Perry-Castañeda Library
Map Collection
Thematic Maps
Climate
Energy
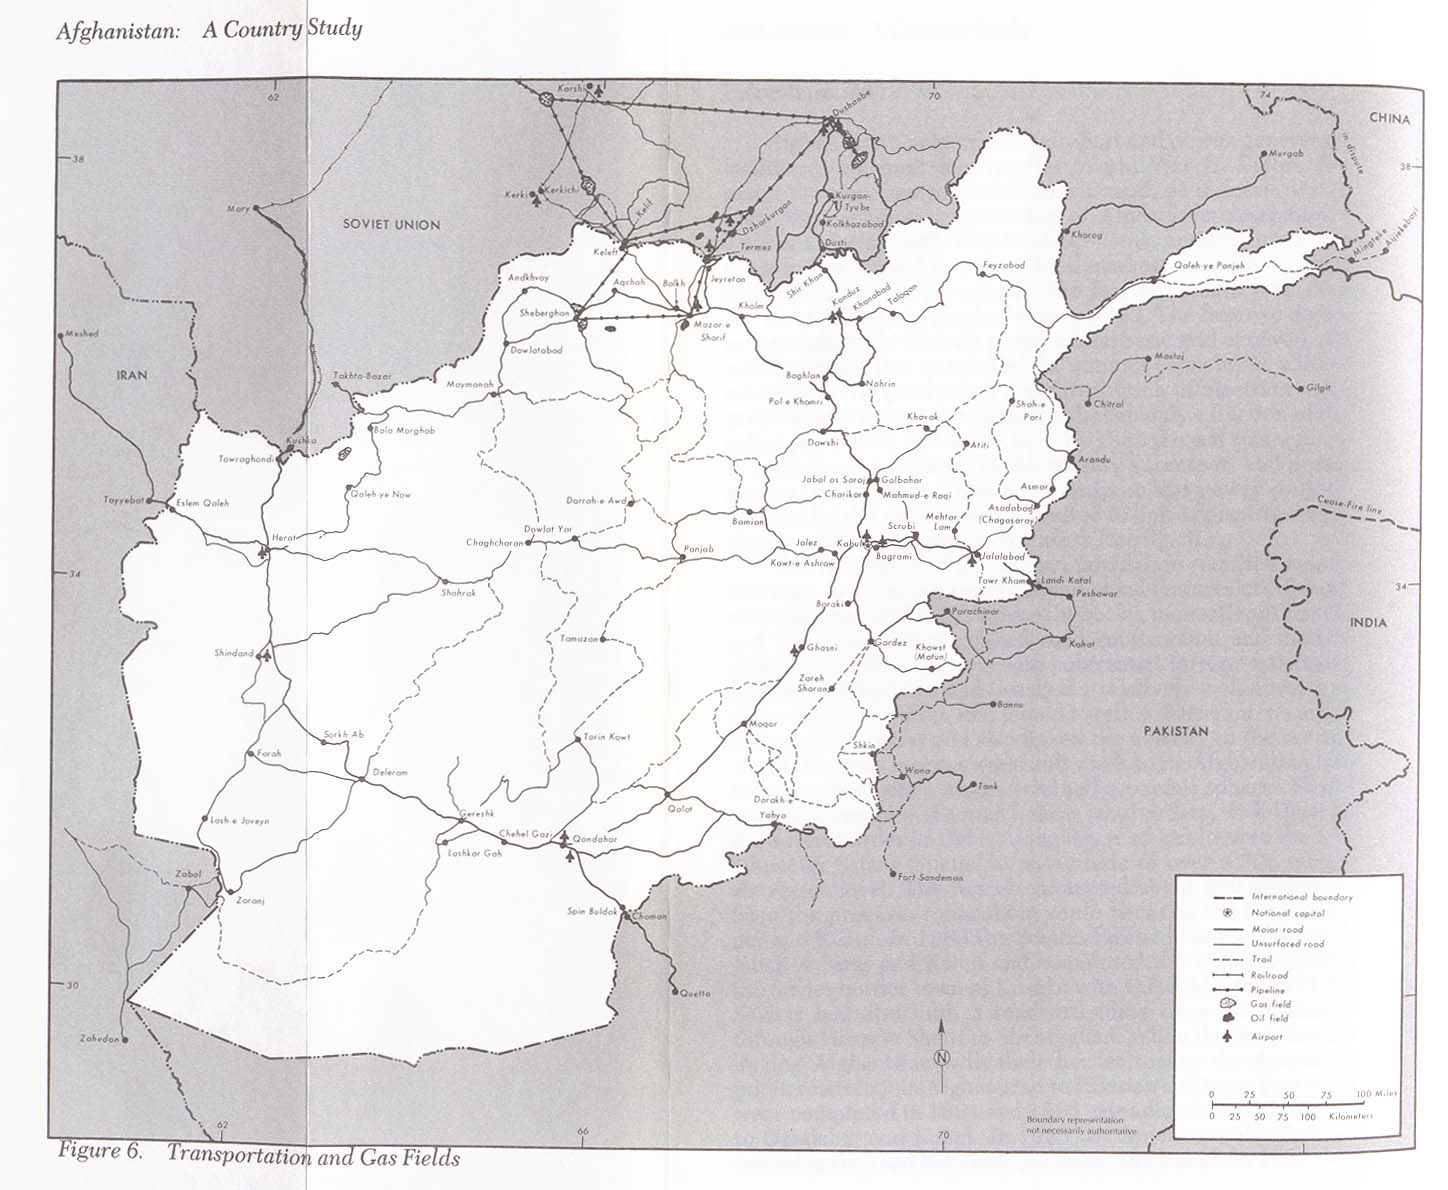
- Afghanistan - Transportation and Gas Fields from Afghanistan: A Country Study, 1986 (138K)
- Belgium - Basic Resources and Processing from Map No. 75519 1968 (74K)
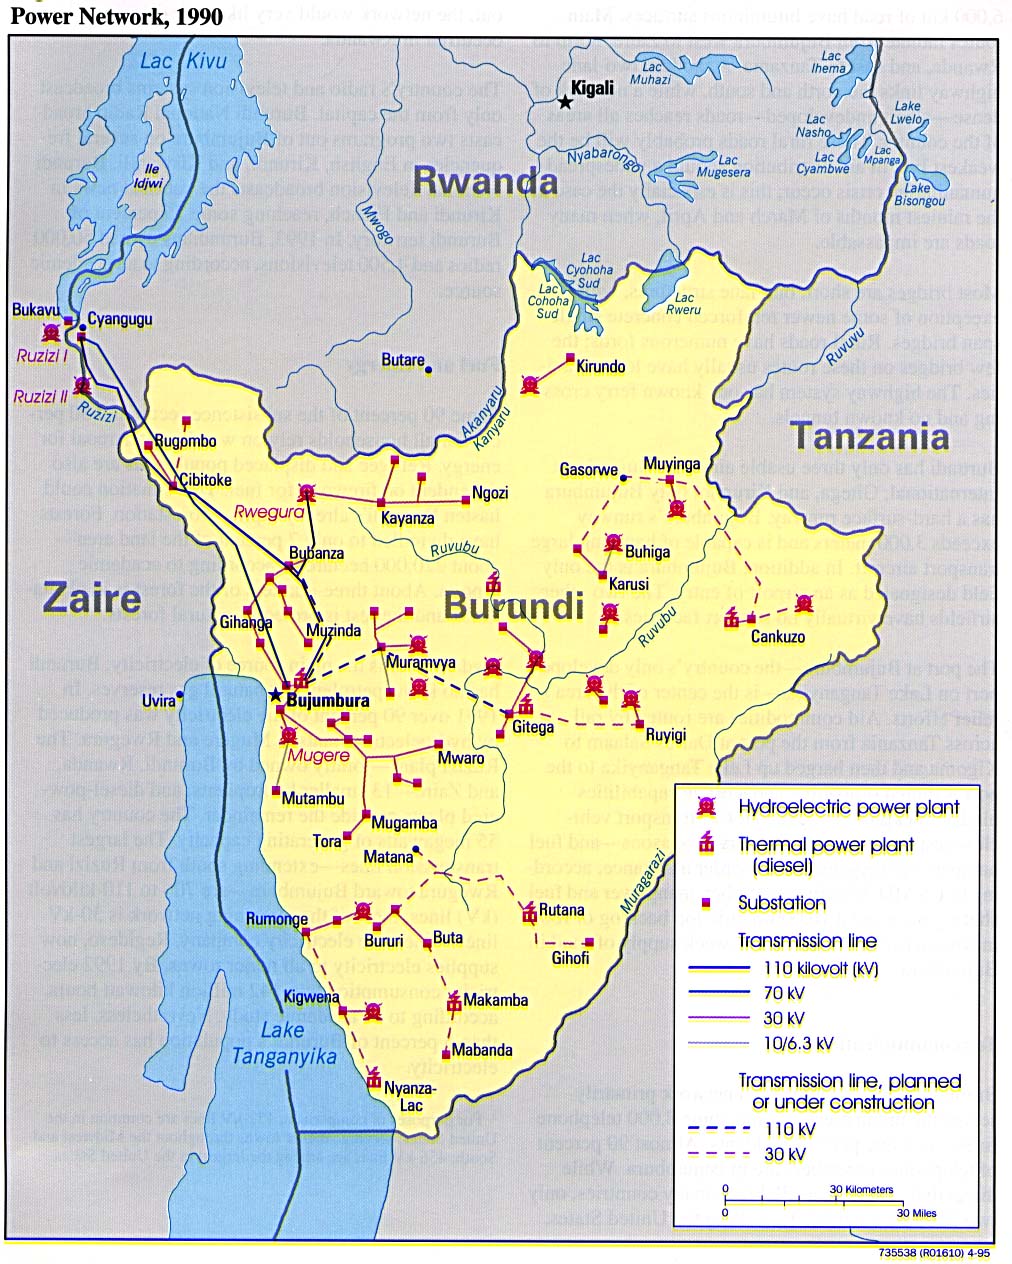
- Burundi - Power Network, 1990 1995 (266K)
- [Caspian Region] Oil and Gas Infrastructure in the Caspian Sea Region 2012 (6.9MB)
- [Caspian Region] Oil and Gas Infrastructure in the Caspian Sea Region 2001 (2.5 MB)
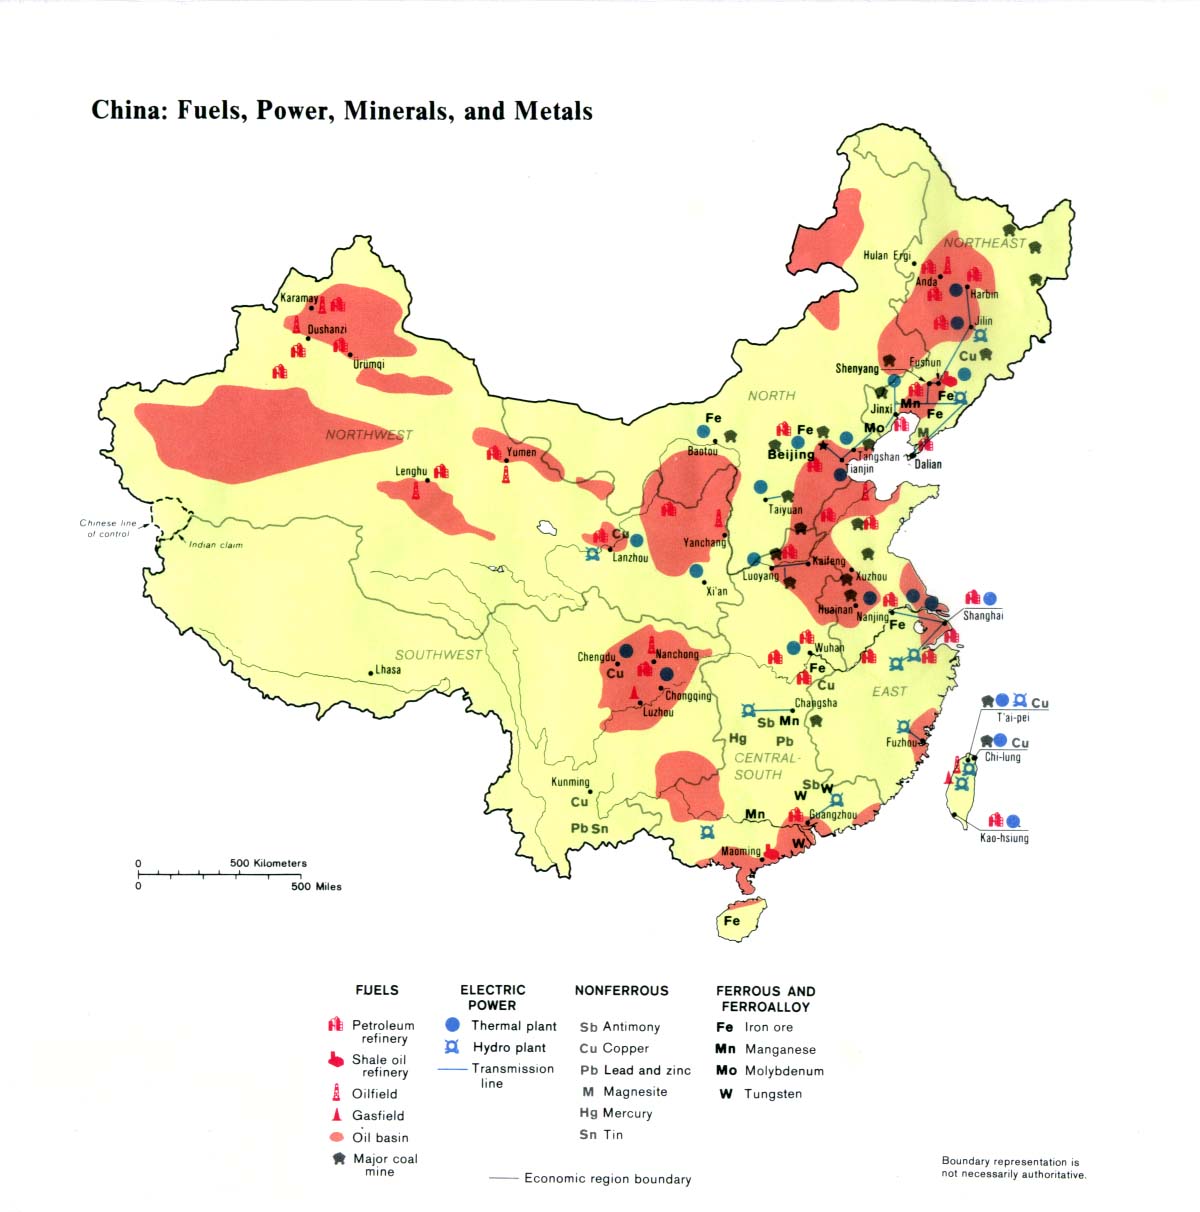
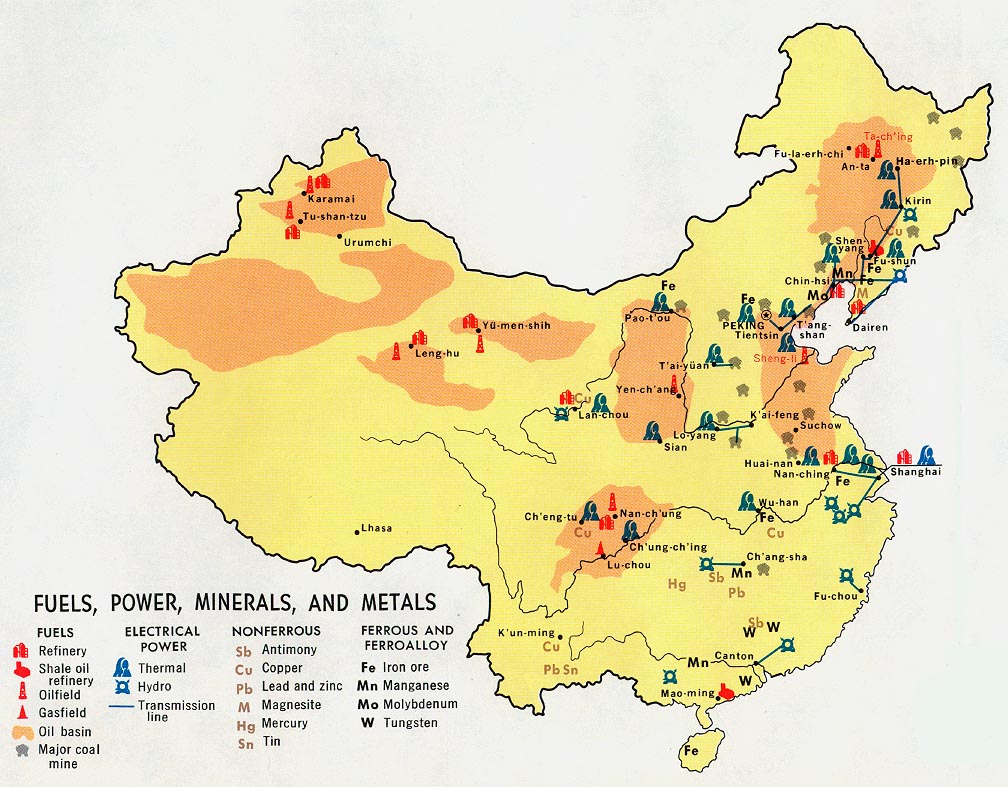
- China - Fuels, Power, Minerals, and Metals 1983 (258K)
- China - Fuels, Power, Minerals, and Metals from Map No. 500410 1971 (183K)
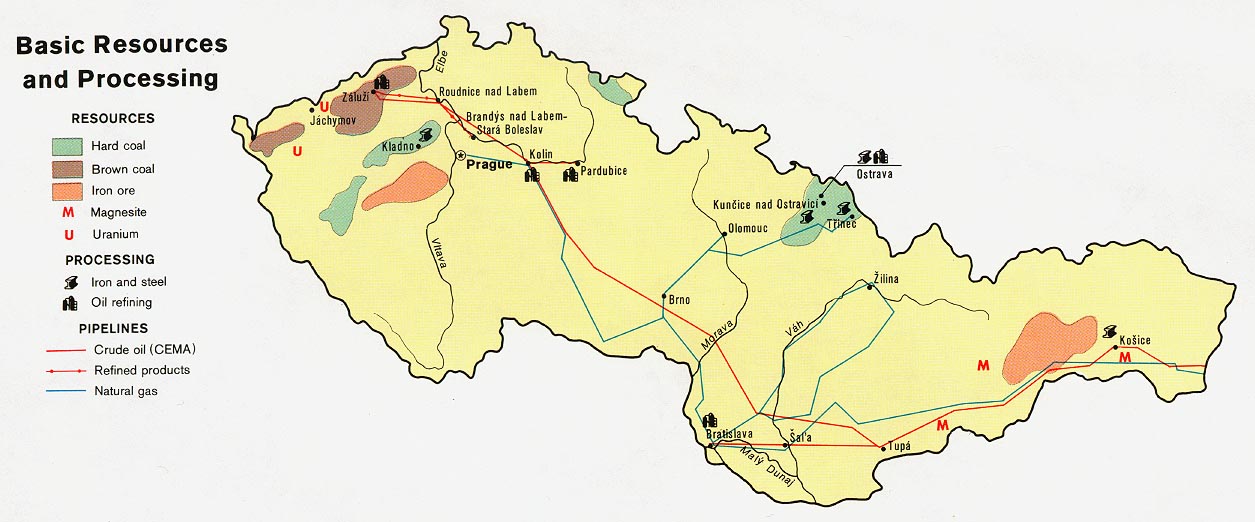
- Czechoslovakia - Basic Resources and Processing from Map No. 501820 1975 (123K)
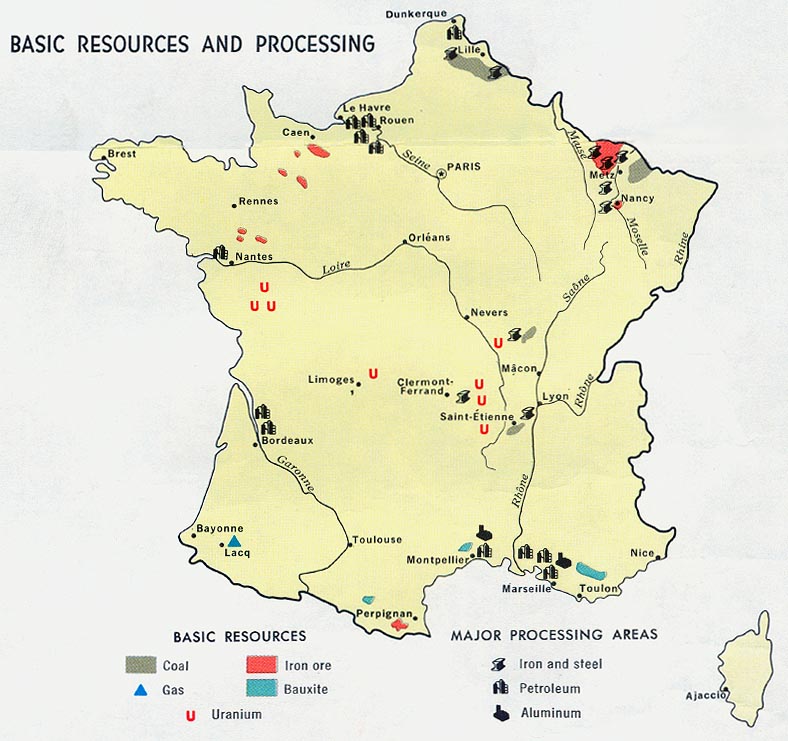
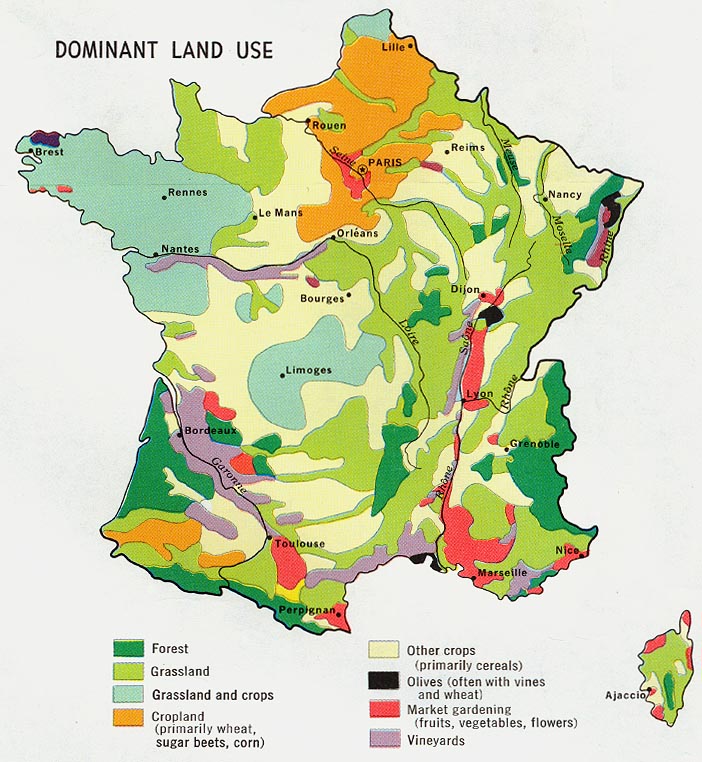
- France - Resources and Processing from Map No. 500197 1972 (119K)
- Germany, Eastern - Resources and Processing from Map No. 504708 1981 (141K)
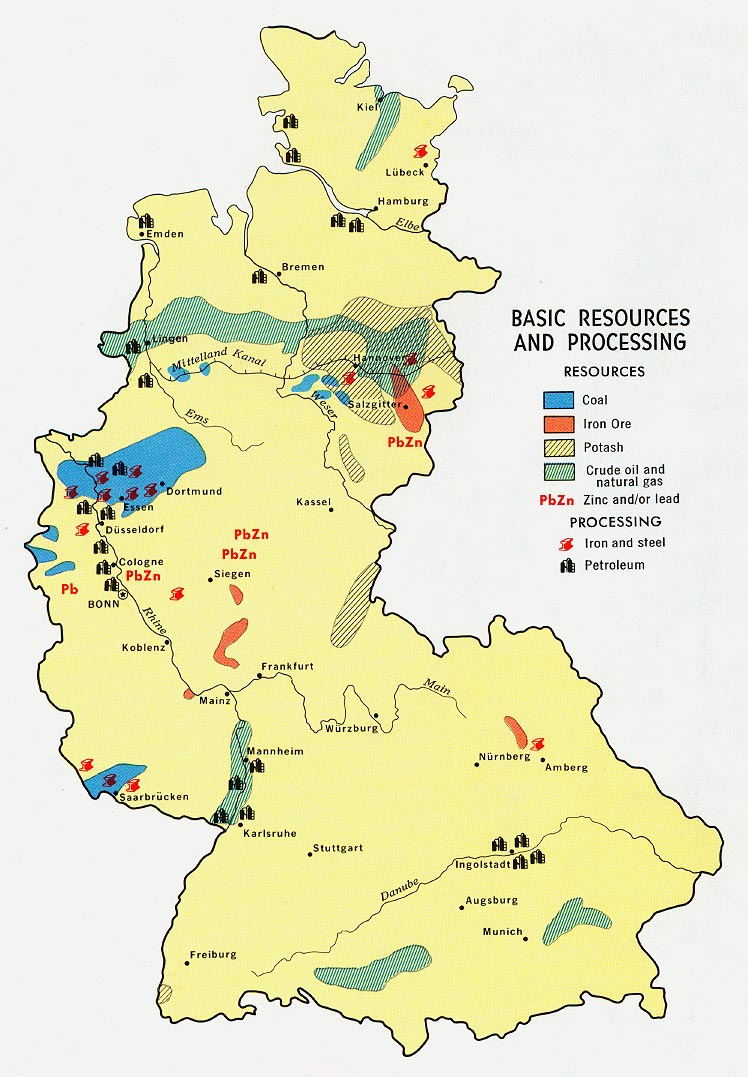
- Germany, Western - Basic Resources from Map No. 500470 1972 (216K)
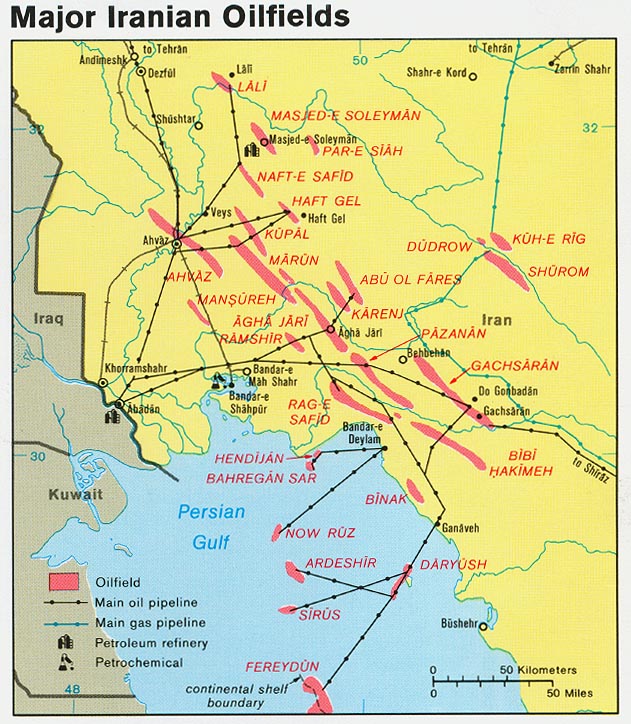
- Iran - Major Iranian Oilfields from Map No. 503828 1978 (166K)
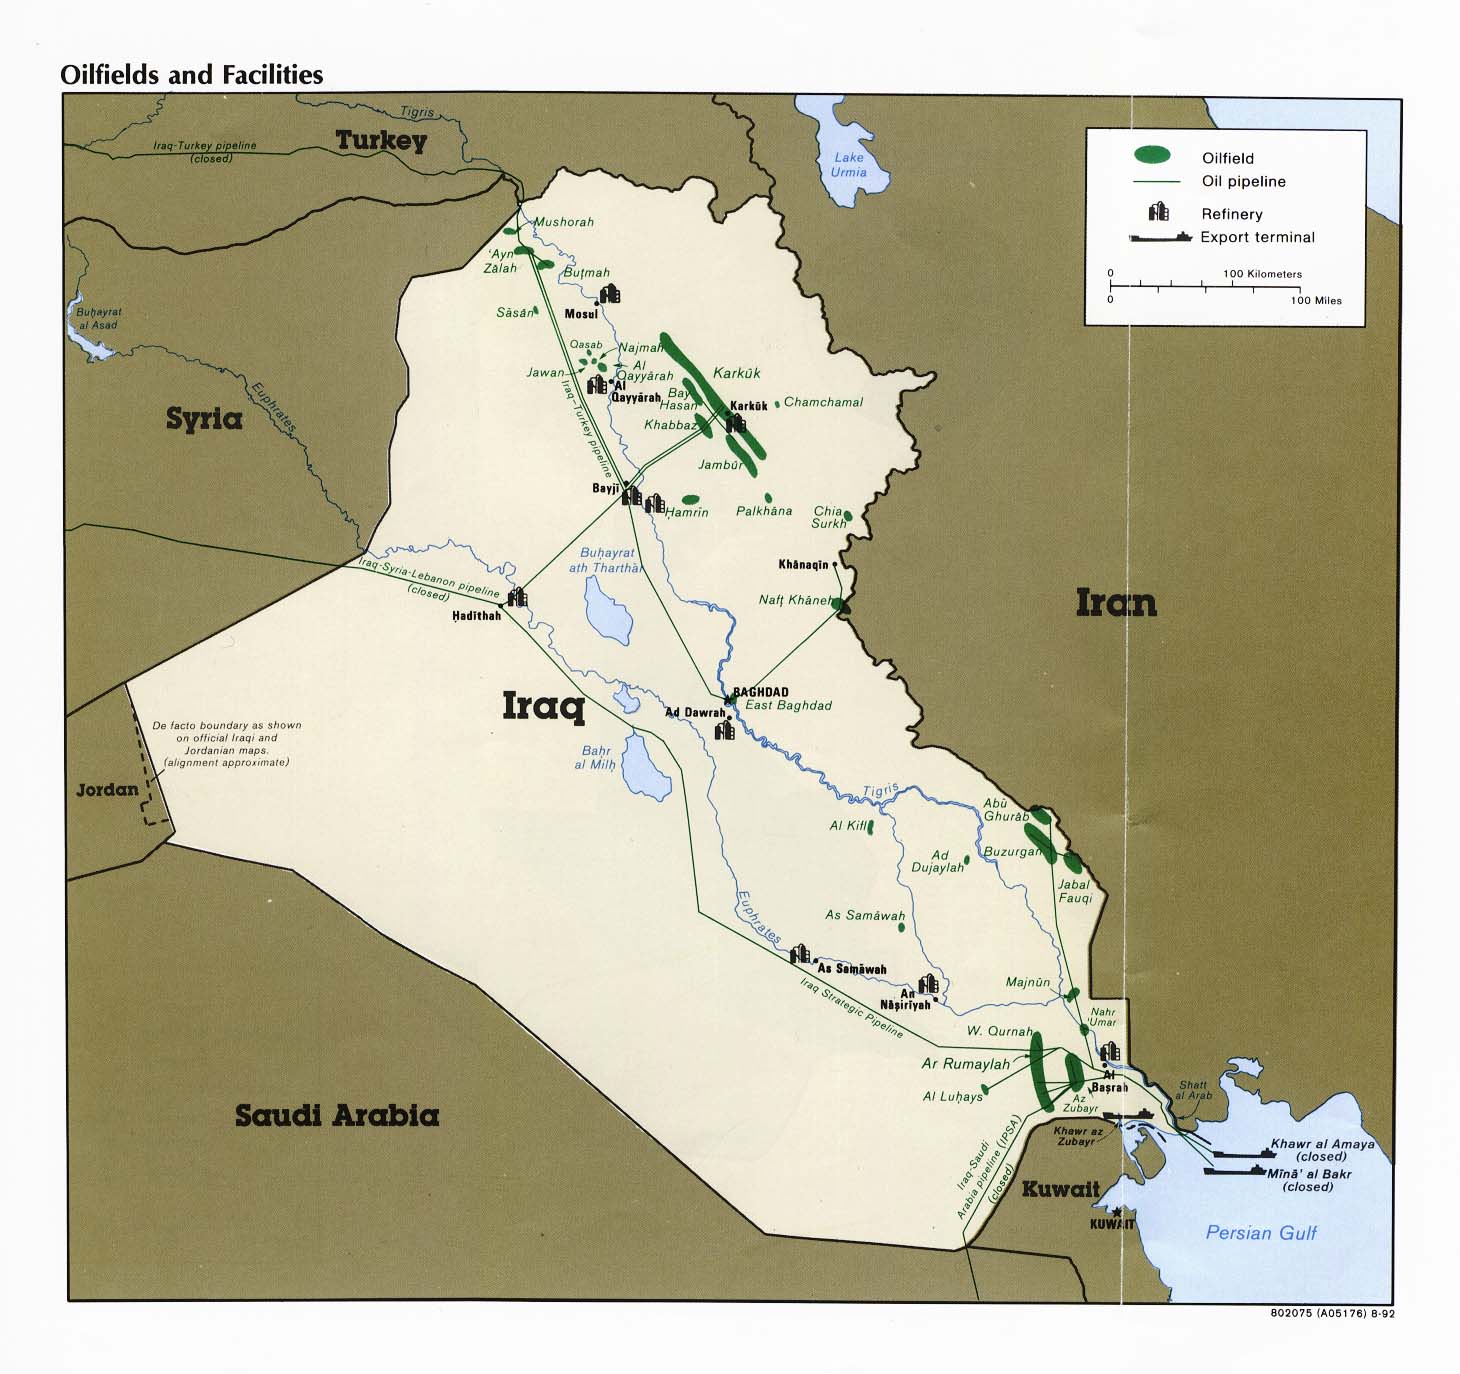
- Iraq - Oilfields and Facilities from Iraq a Map Folio, CIA, 1992 (182K)
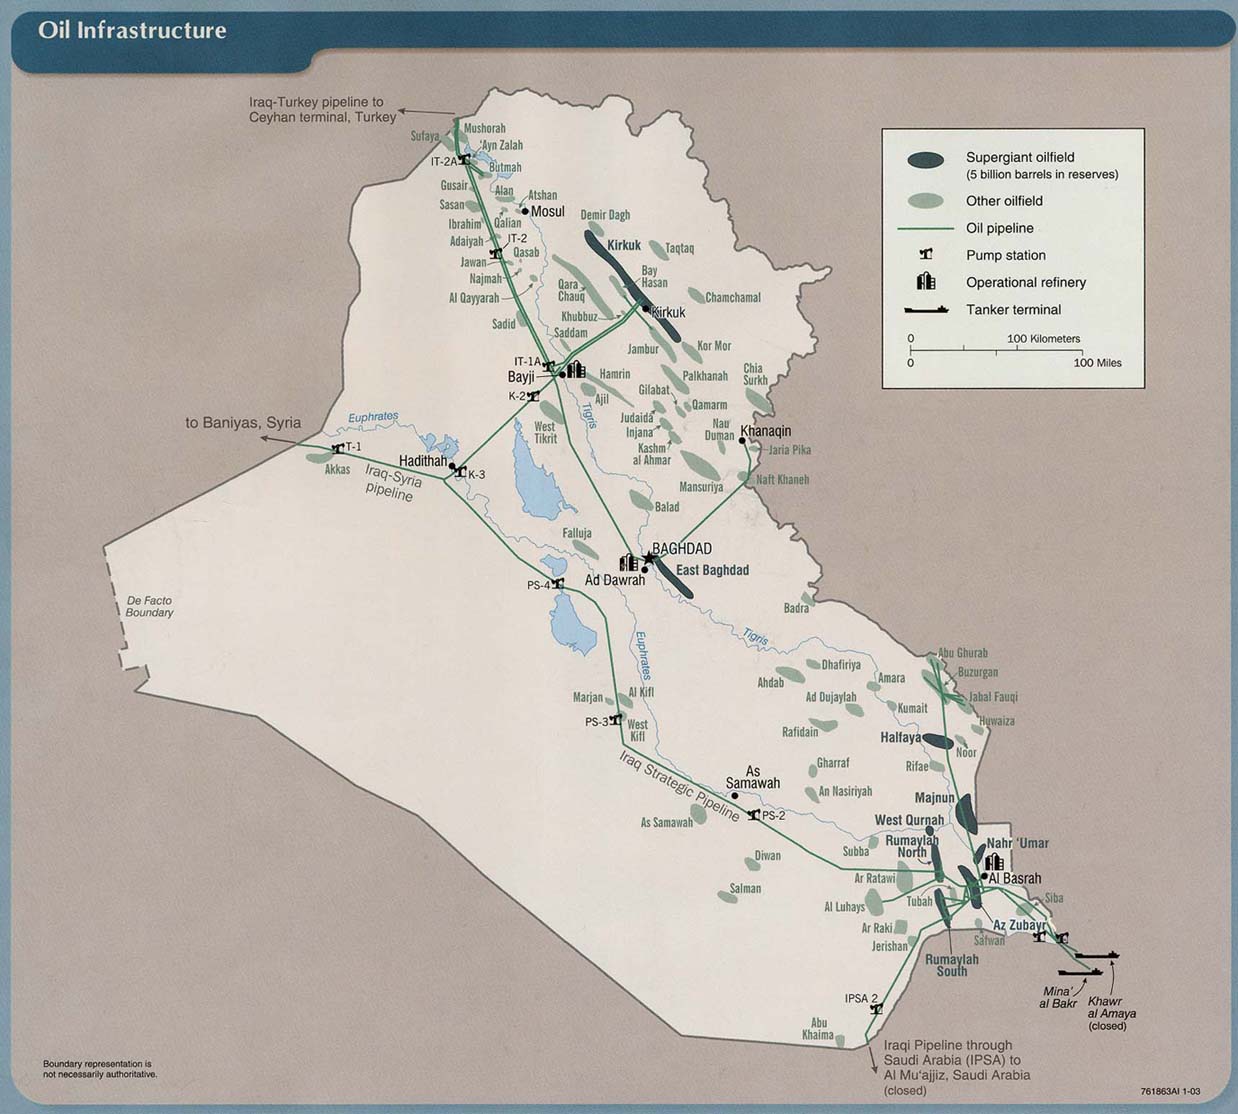
- Iraq - Oil Infrastructure from Iraq: Country Profile [map], CIA, January 2003 (157K) and
pdf format (160K)
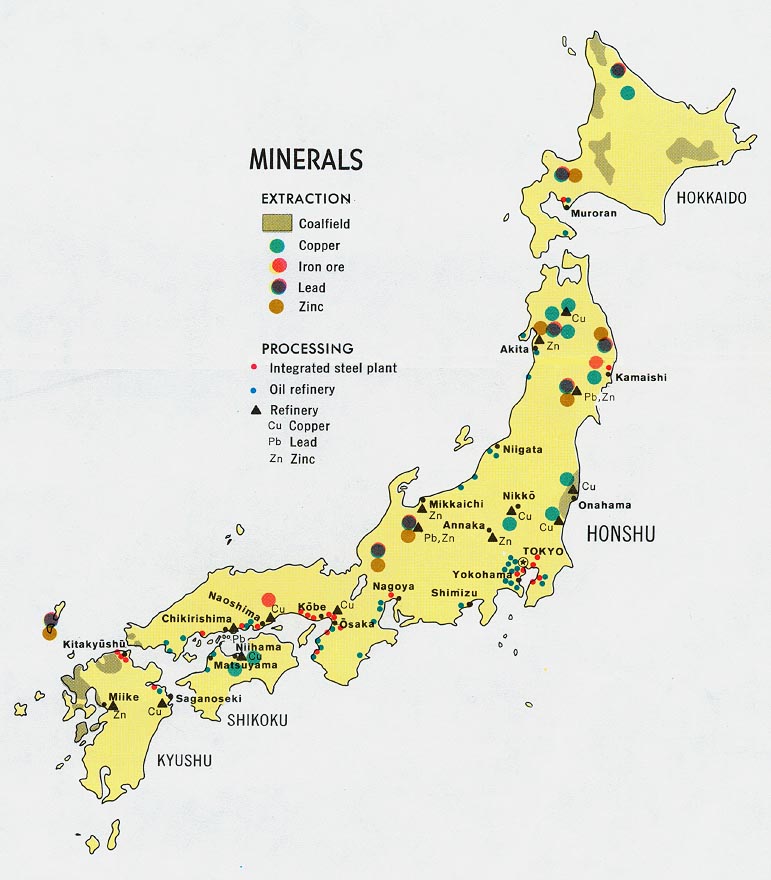
- Japan - Minerals from Map No. 78643 1971 (110K)
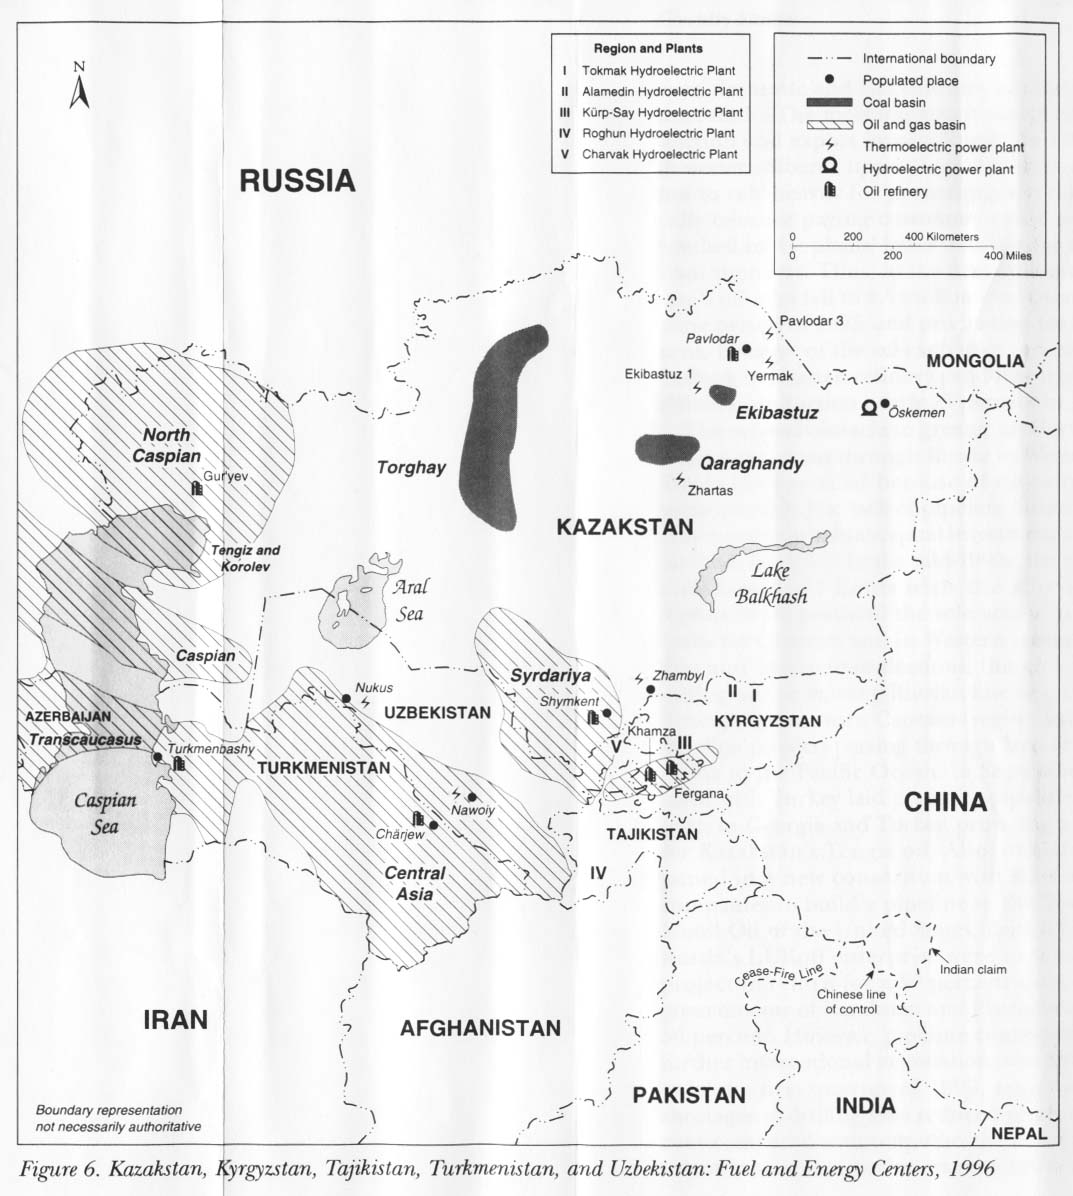
- Kazakstan, Kyrgyzstan, Tajikistan, Turkmenistan, and Uzbekistan: Fuel and Energy Centers 1996 from Kazakstan, Kyrgyzstan, Tajikistan, Turkmenistan, and Uzbekistan: Country Studies. 1997 (142K)
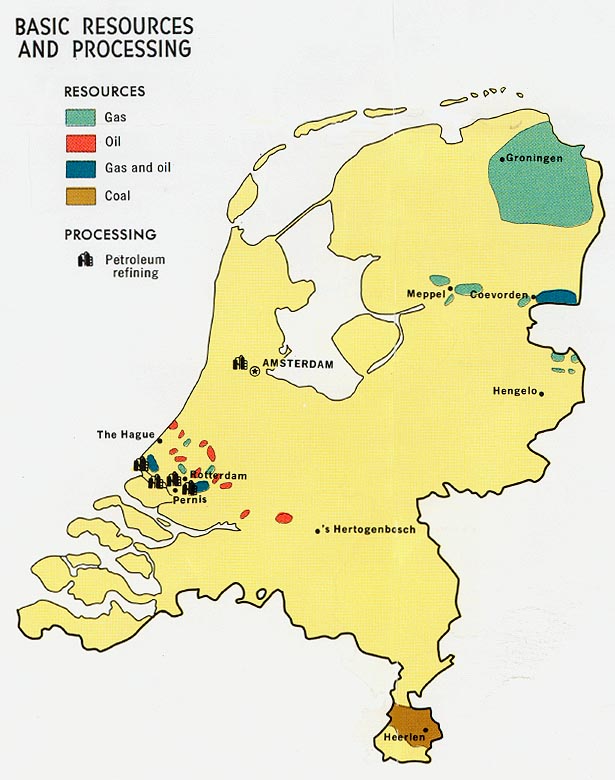
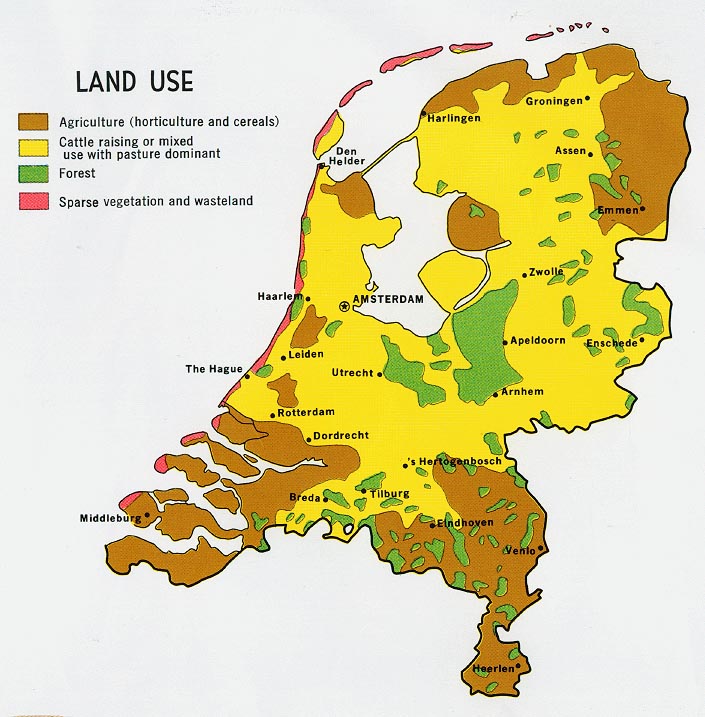
- Netherlands - Basic Resources and Processing from Map No. 76863 1970 (98K)
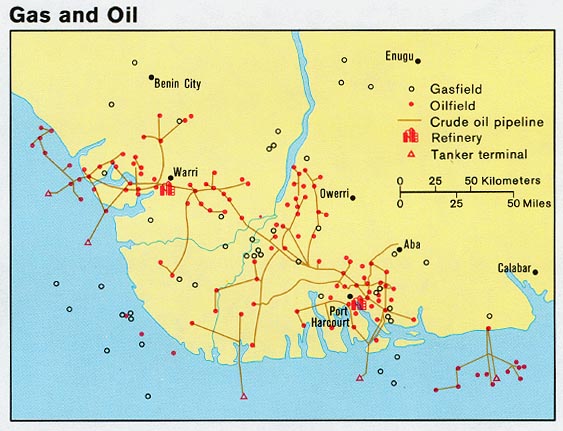
- Nigeria - Gas and Oil from Map No. 504014 1979 (80K)
- Romania - Basic Resources and Processing from Map No. 76858 1970 (143K)
- [Russia] Soviet Union - Electric Power from Map No. 501614 1974 (178K)
- [Russia] Soviet Union - Metallurgy from Map No. 501614 1974 (139K)
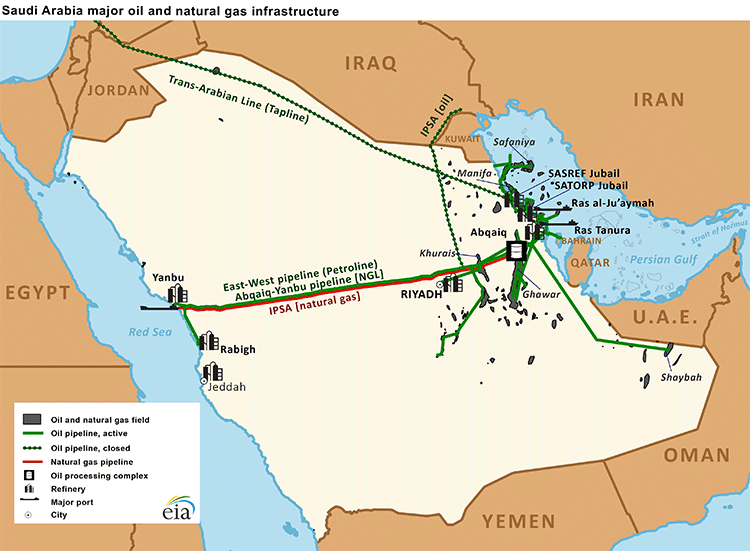
- Saudi Arabia - Major Oil and Natural Gas Infrastructure U.S. Energy Information Administration 2014 (89K)
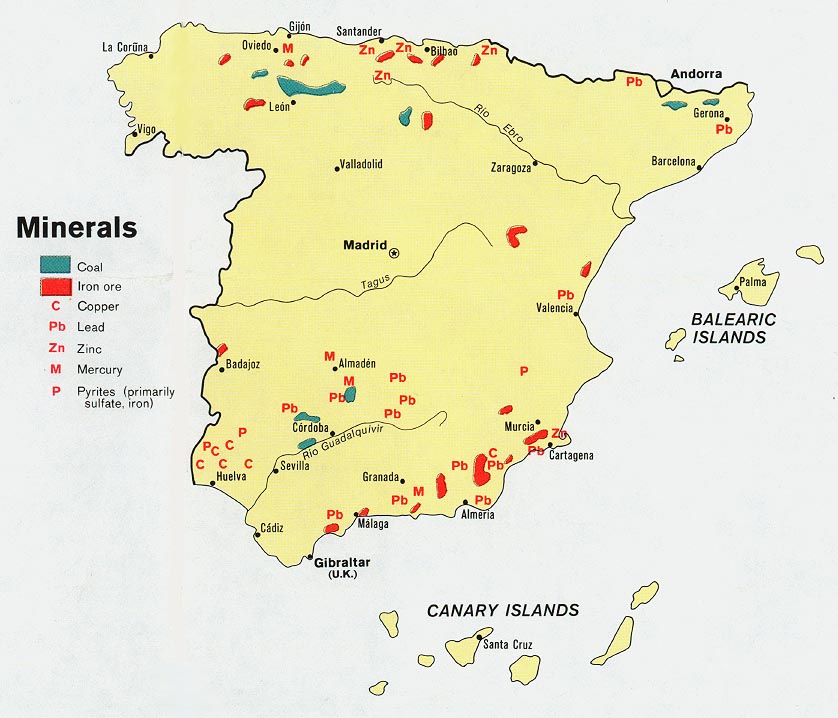
- Spain - Minerals from Map No. 501745 1974 (115K)
- Sudan - Oil and Gas Concession Holders U.S. Agency for International Development 2001 (1.1MB) [pdf format]
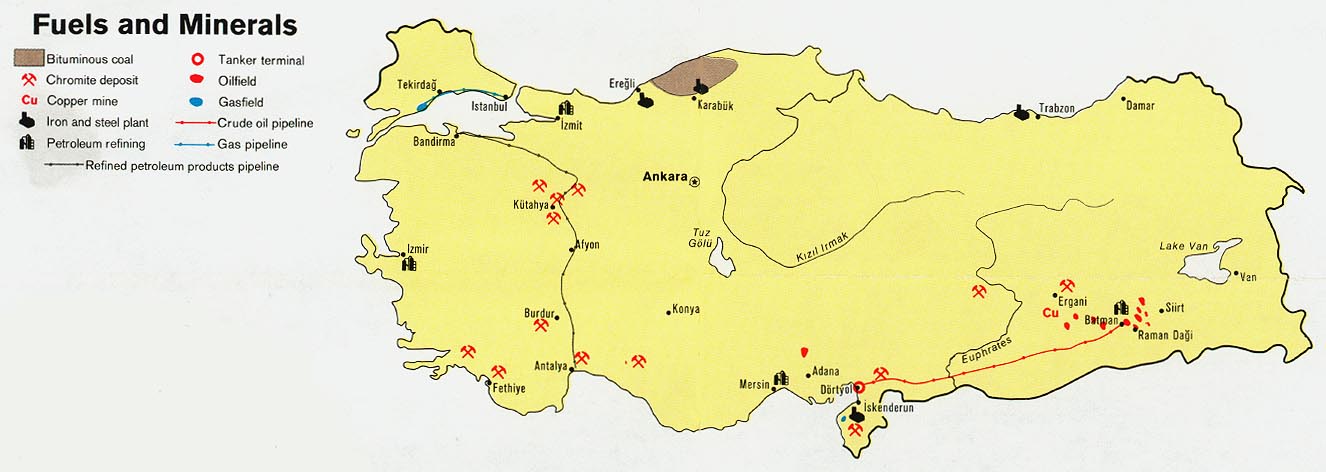
- Turkey - Fuels and Minerals from Map No. 501871 1974 (94K)
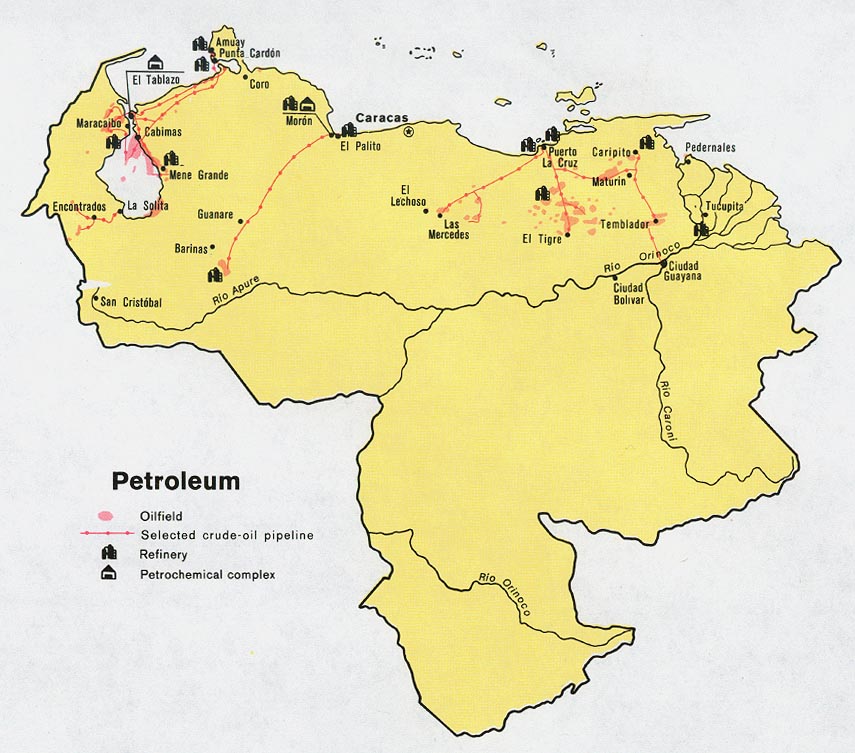
- Venezuela - Petroleum from Map No. 500516 1972 (131K)
- [Zimbabwe] Rhodesia - Mining from Map No. 543857 1979 (119K)
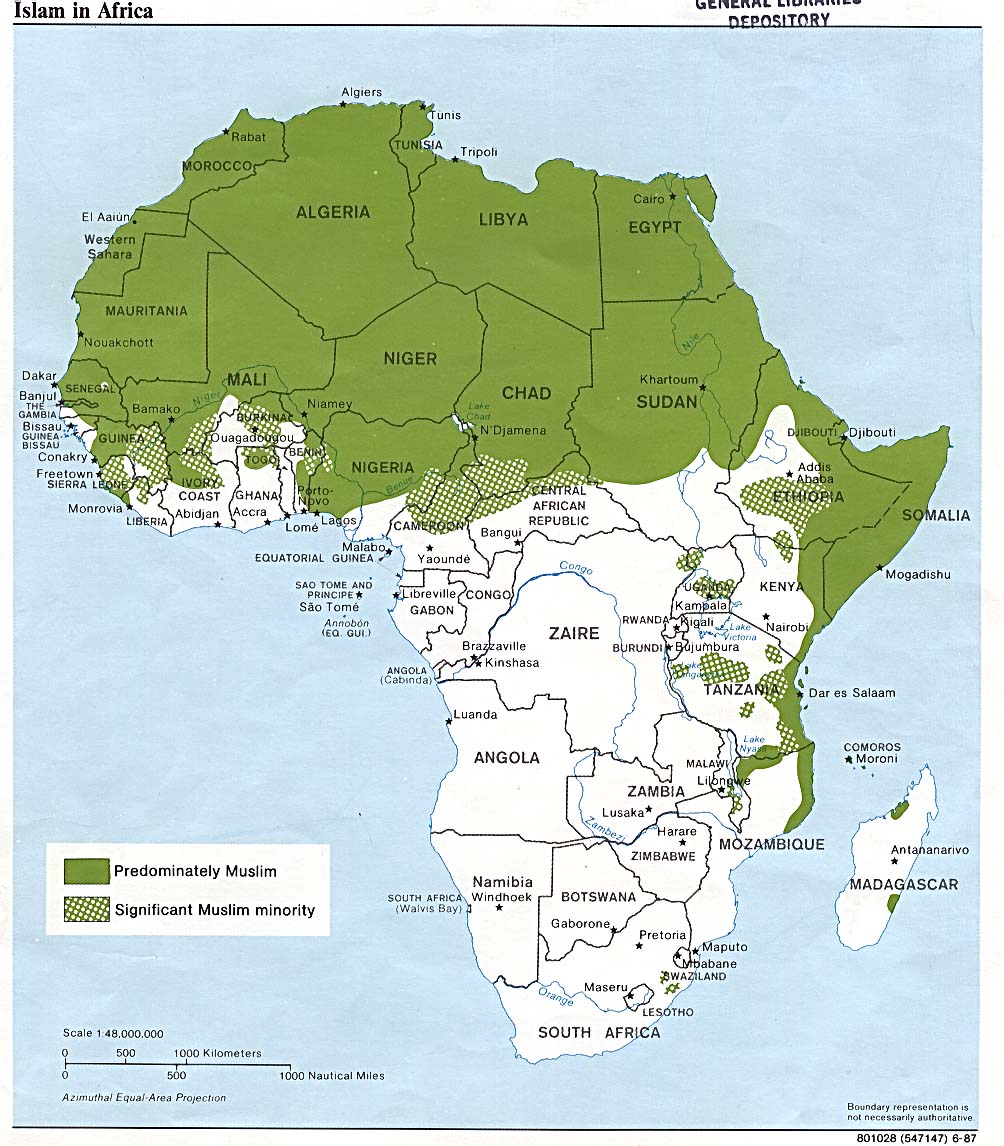
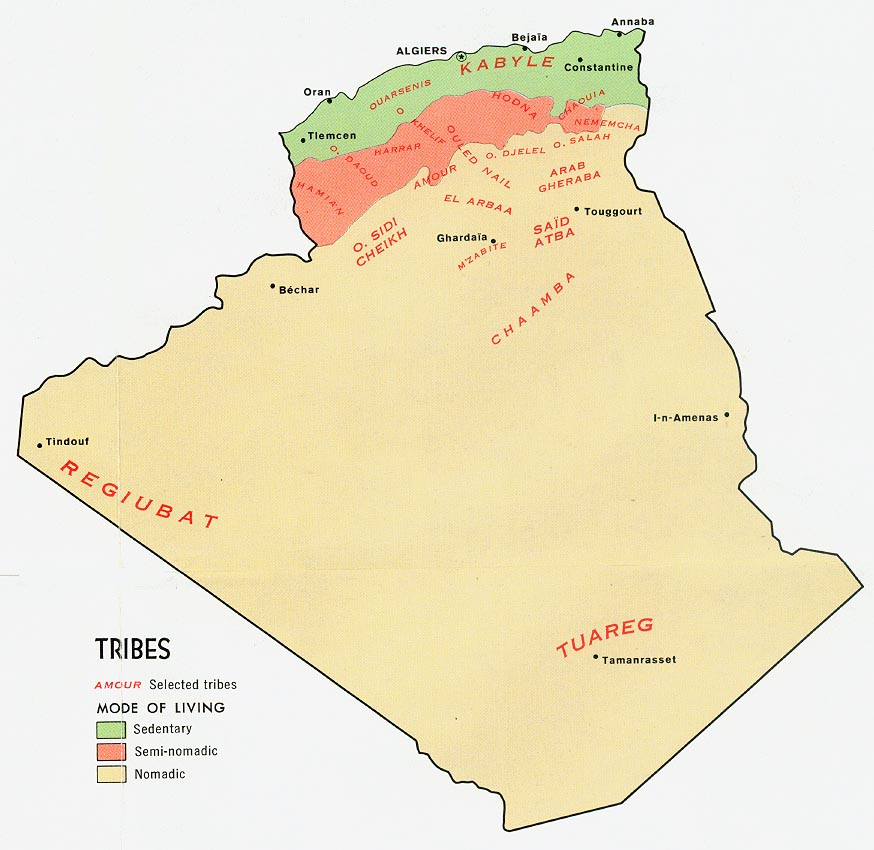
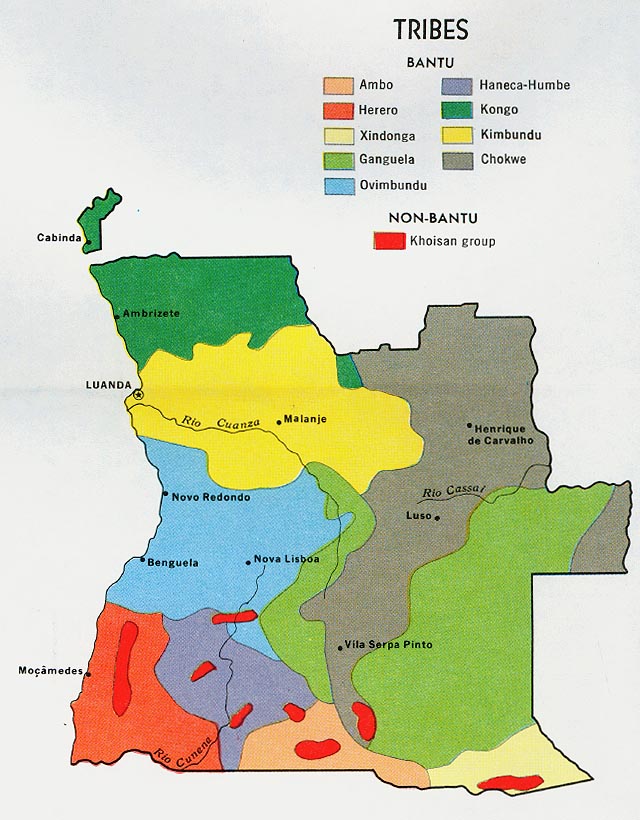
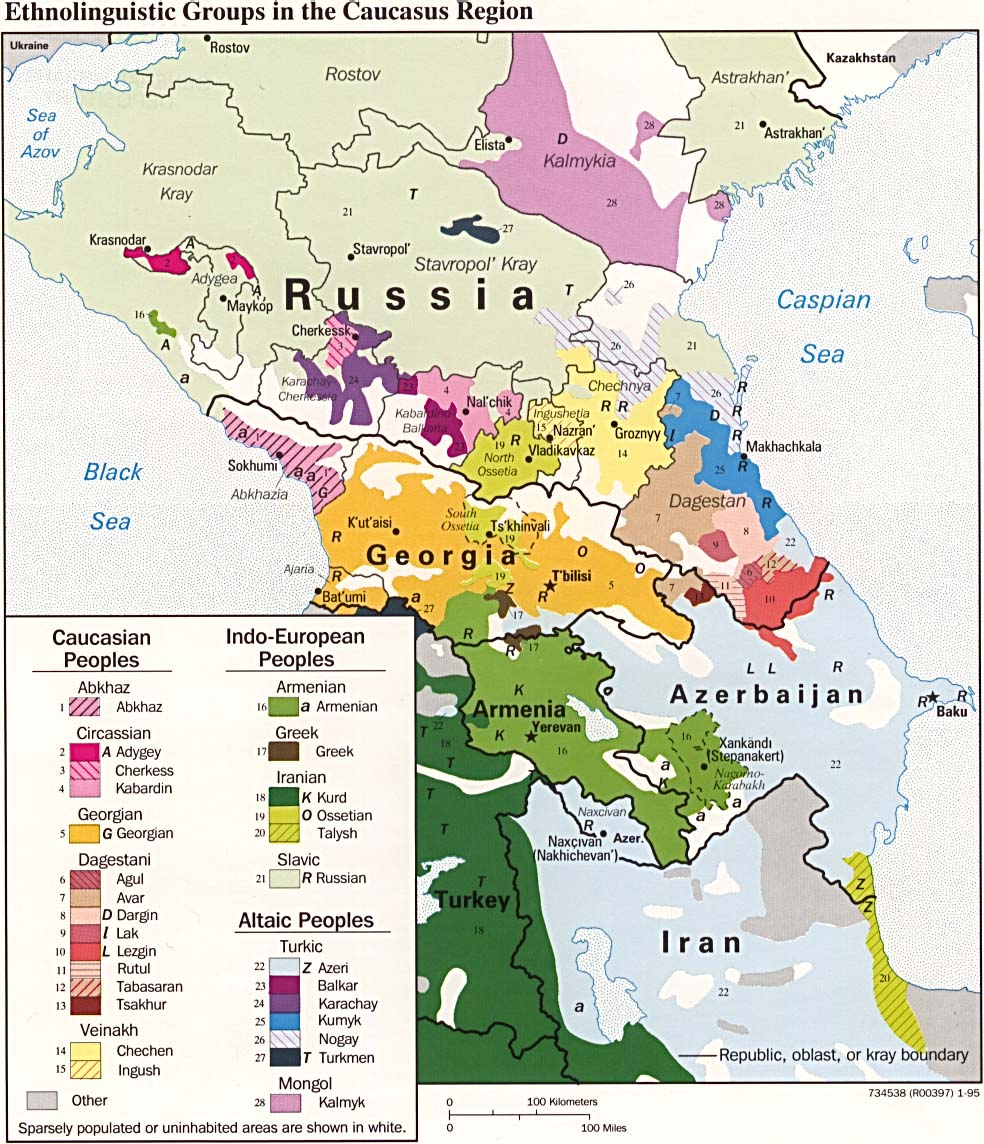
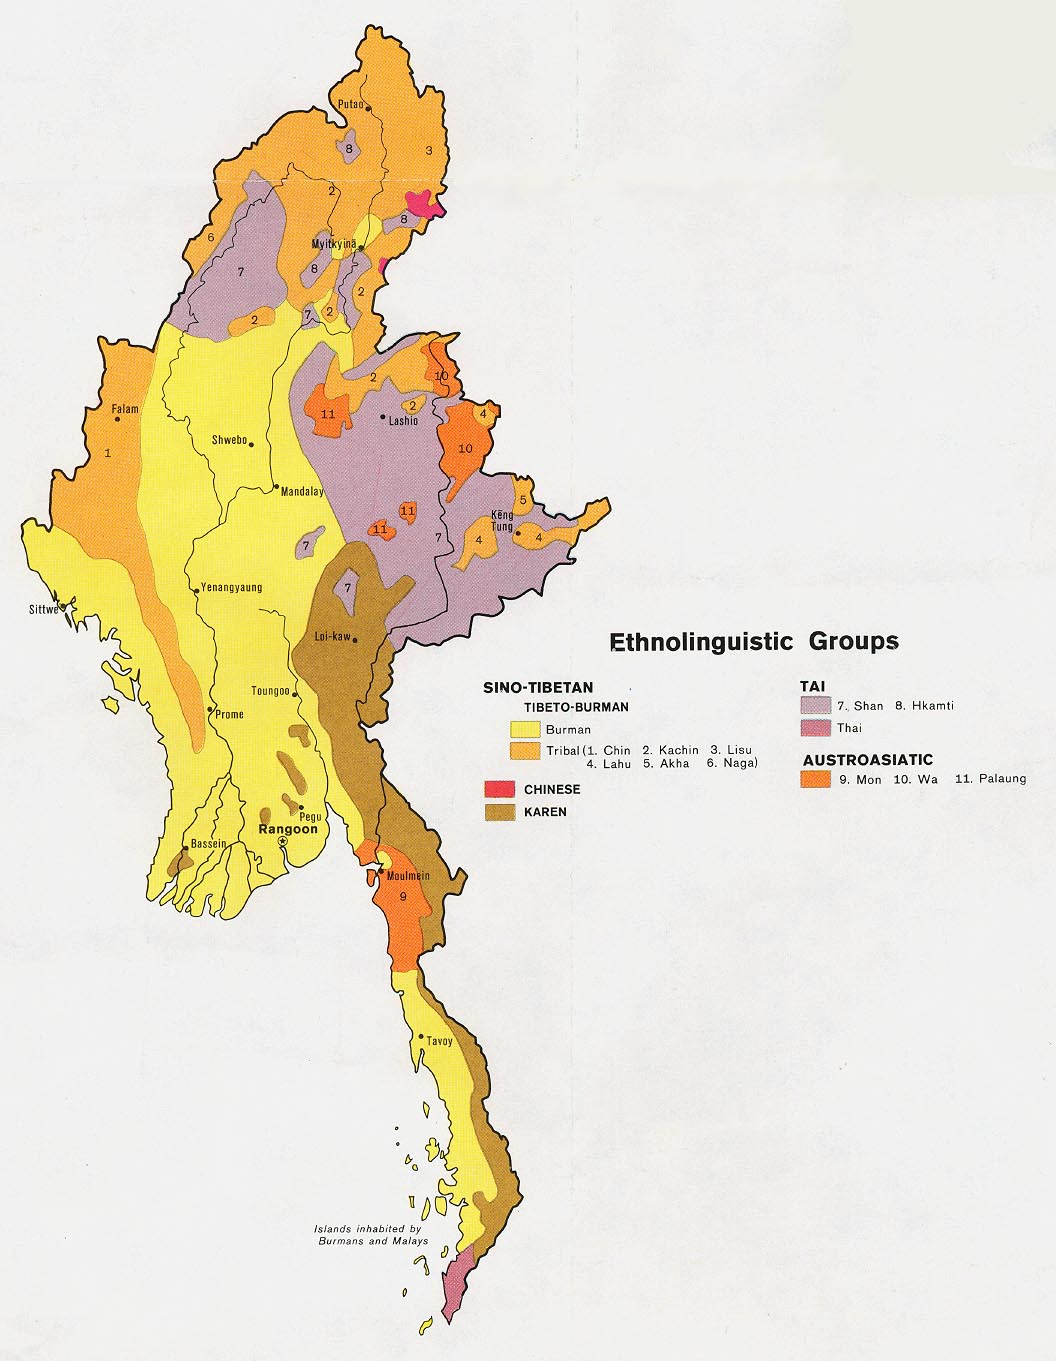
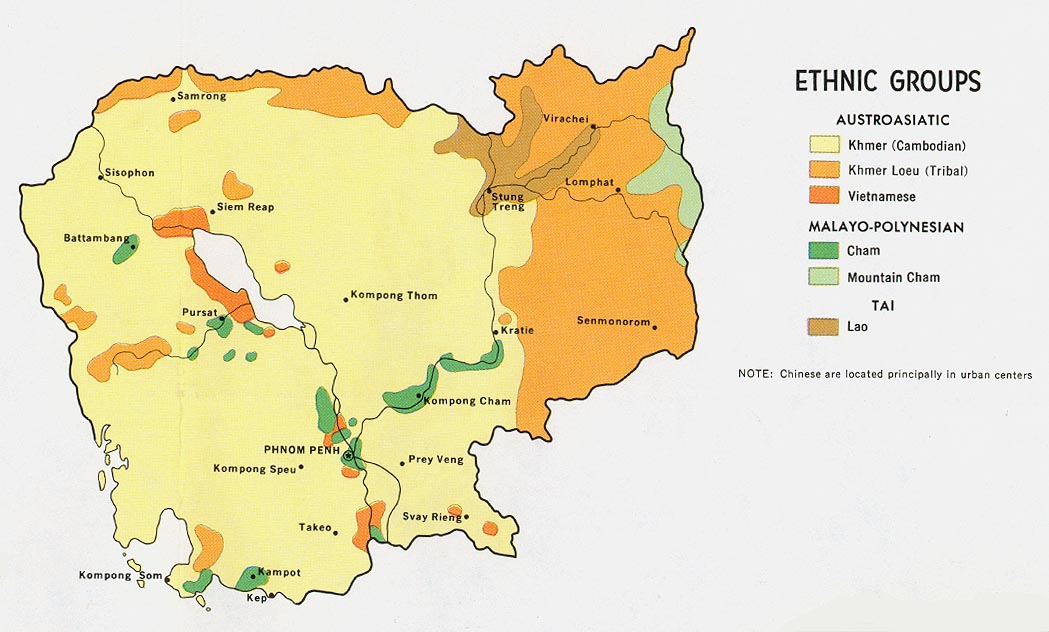
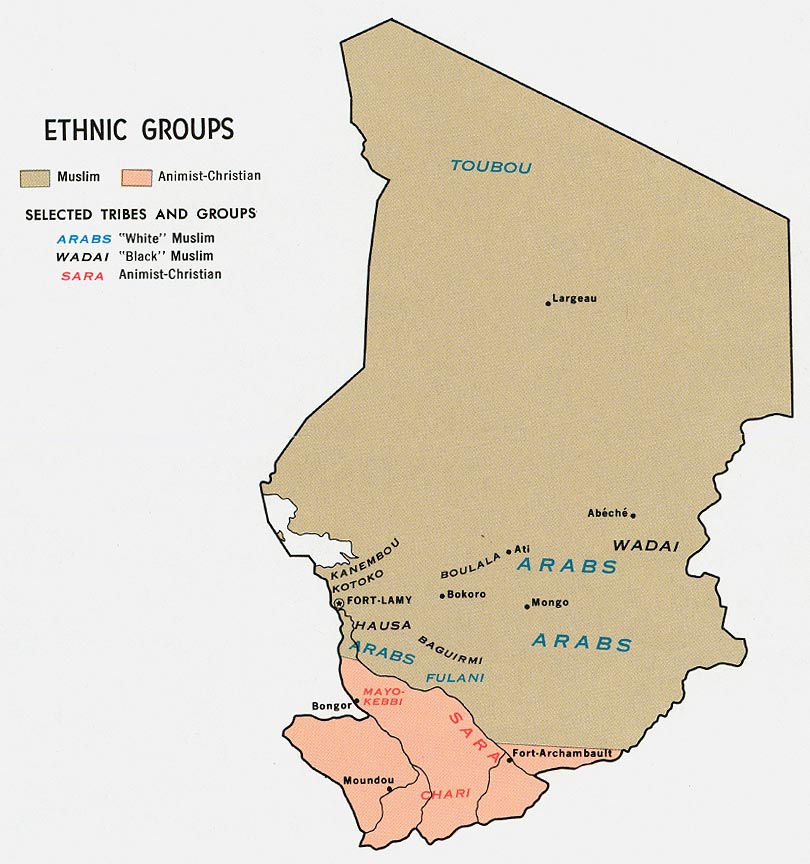
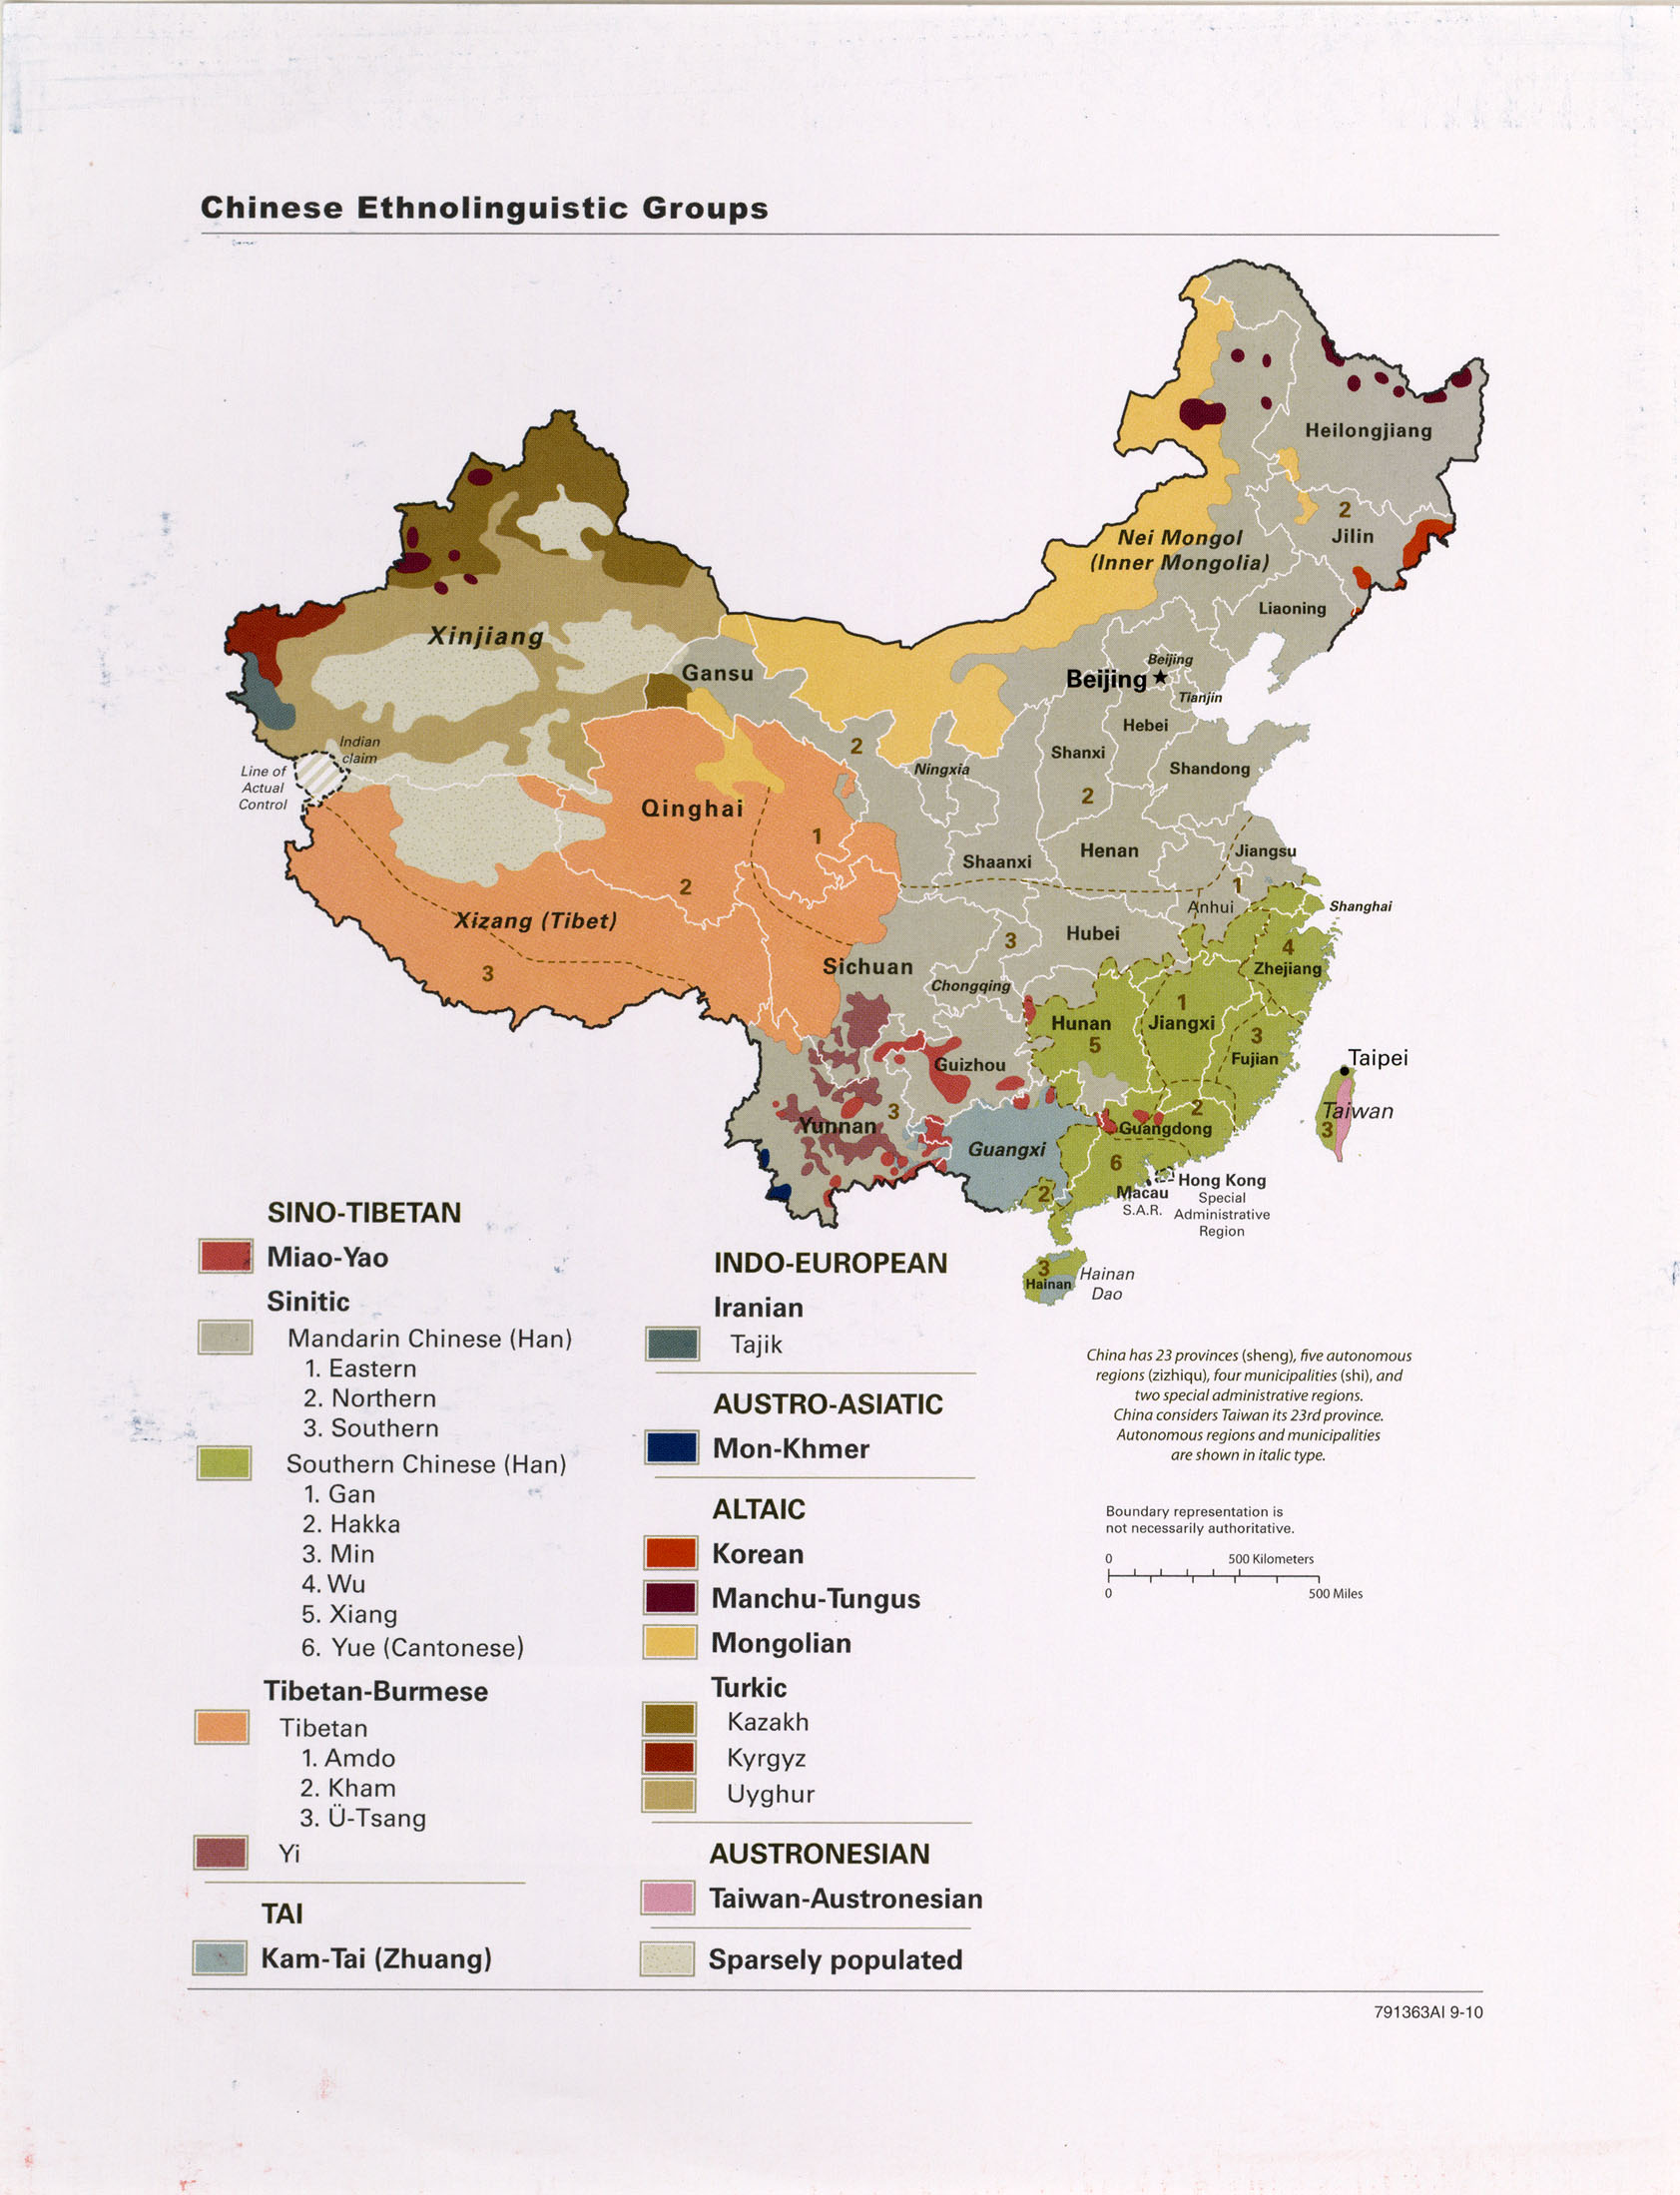
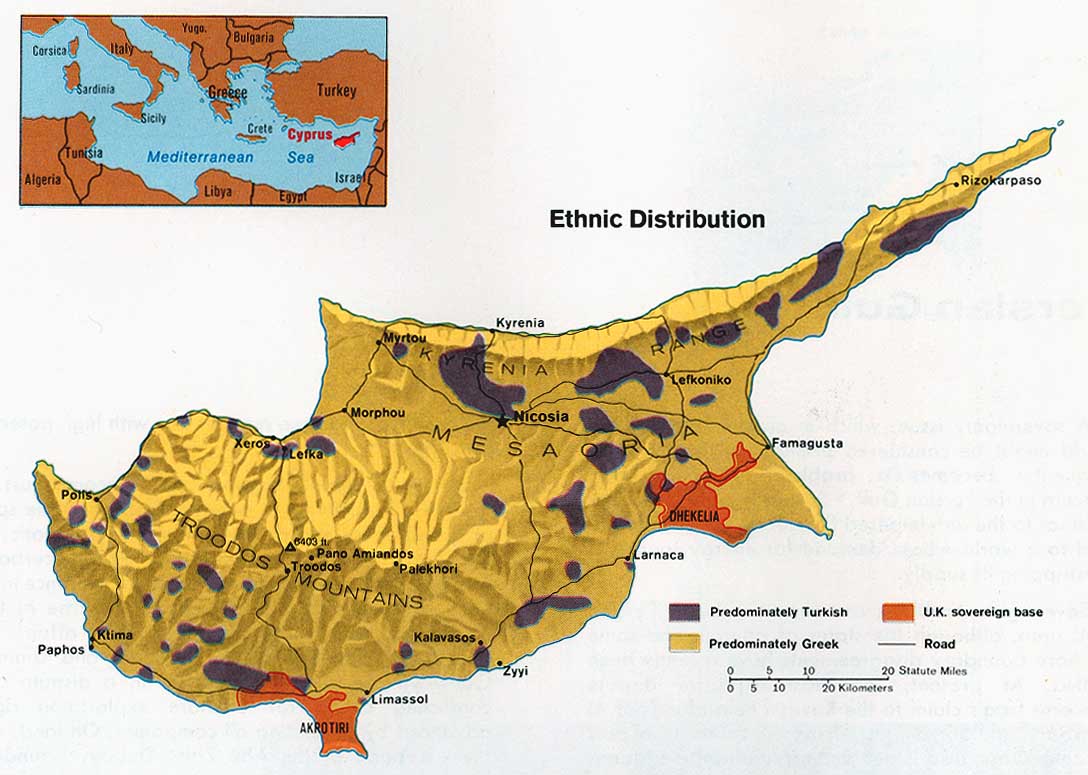
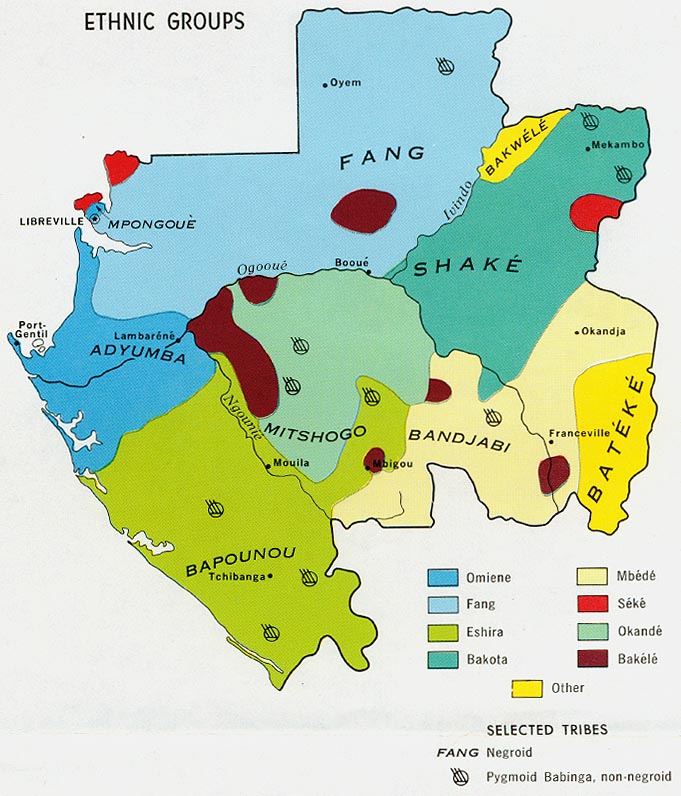
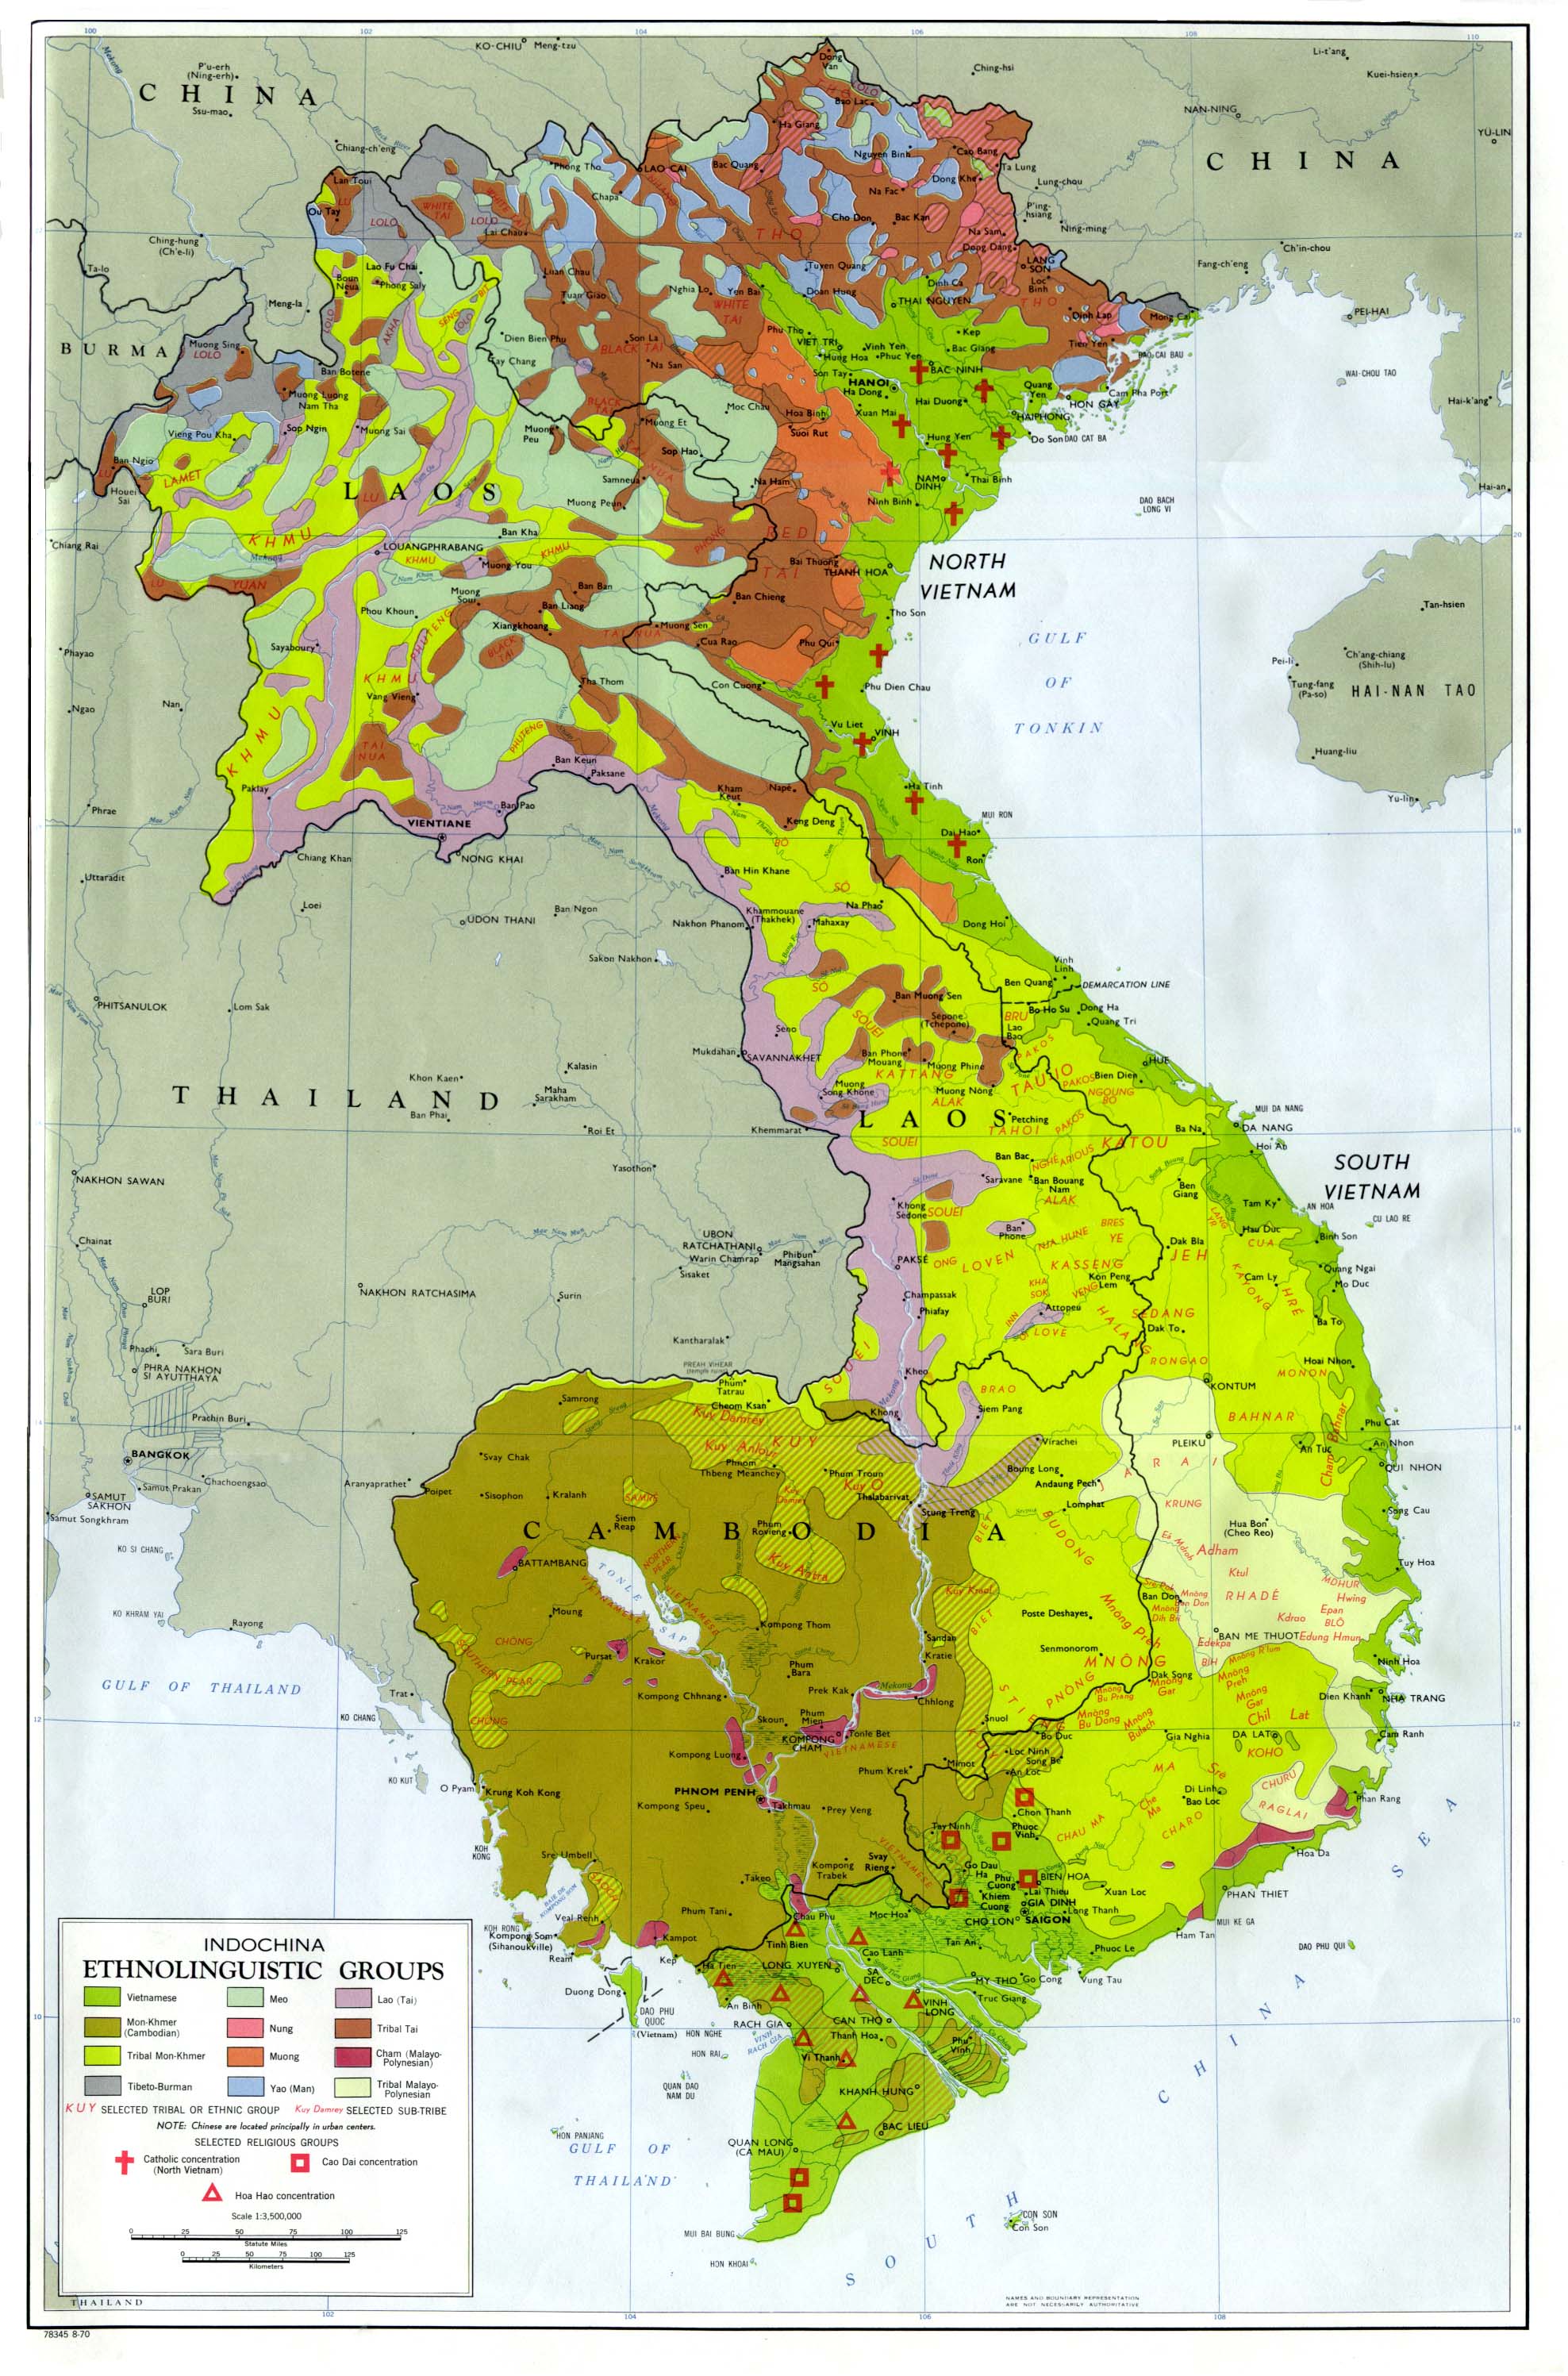
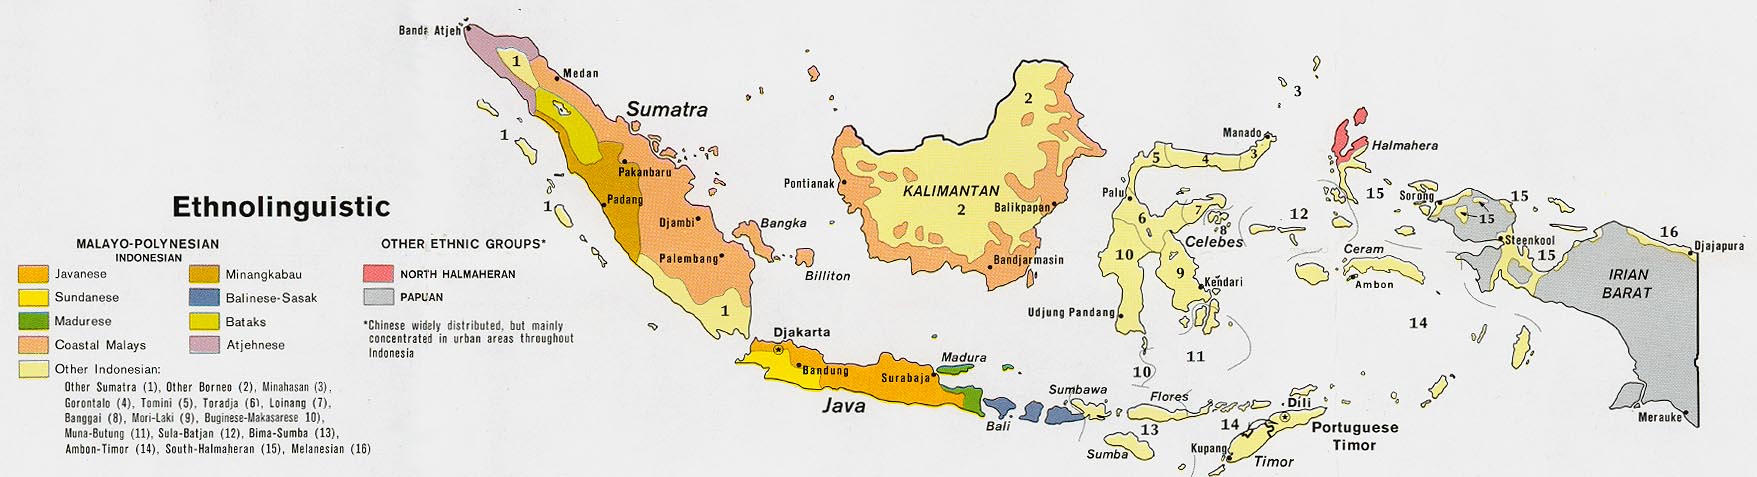
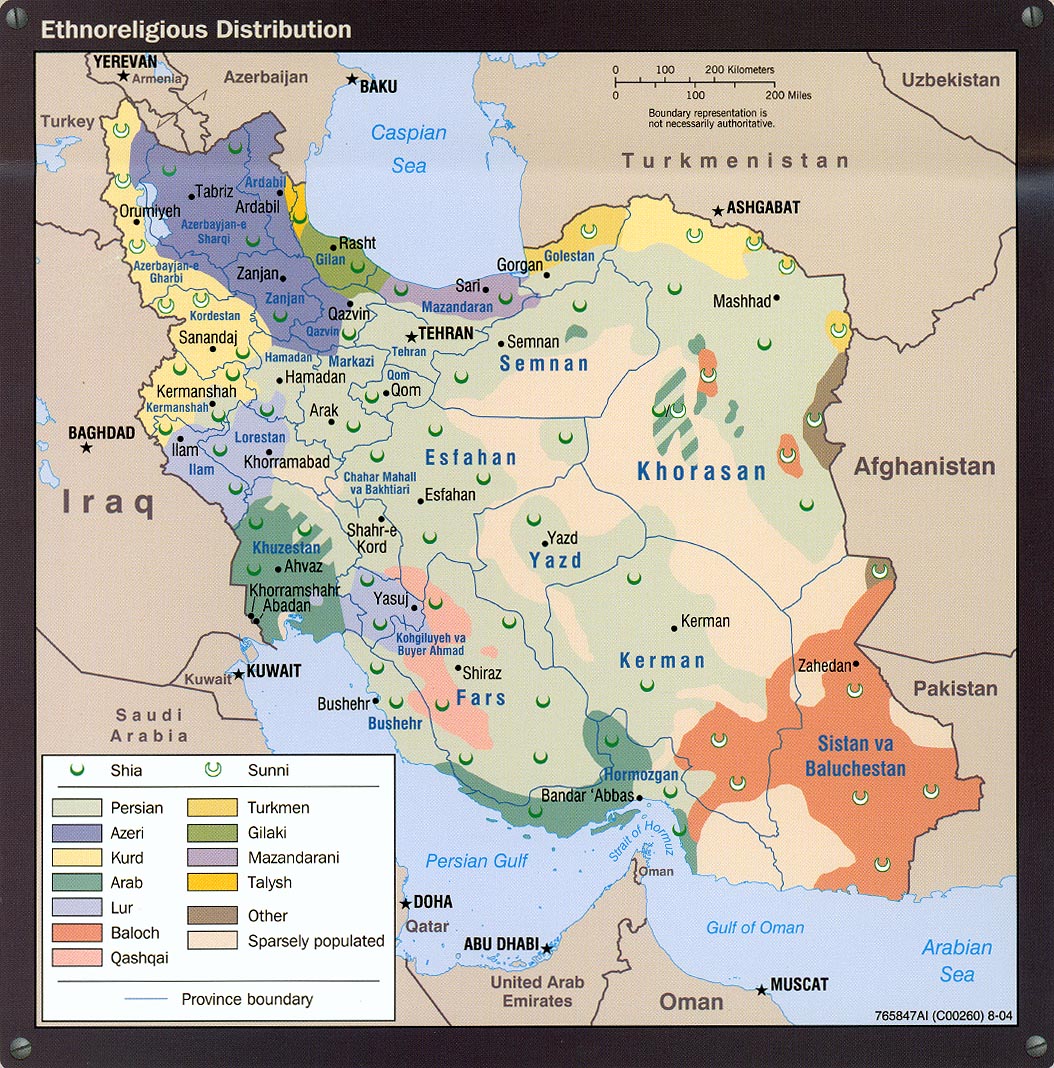
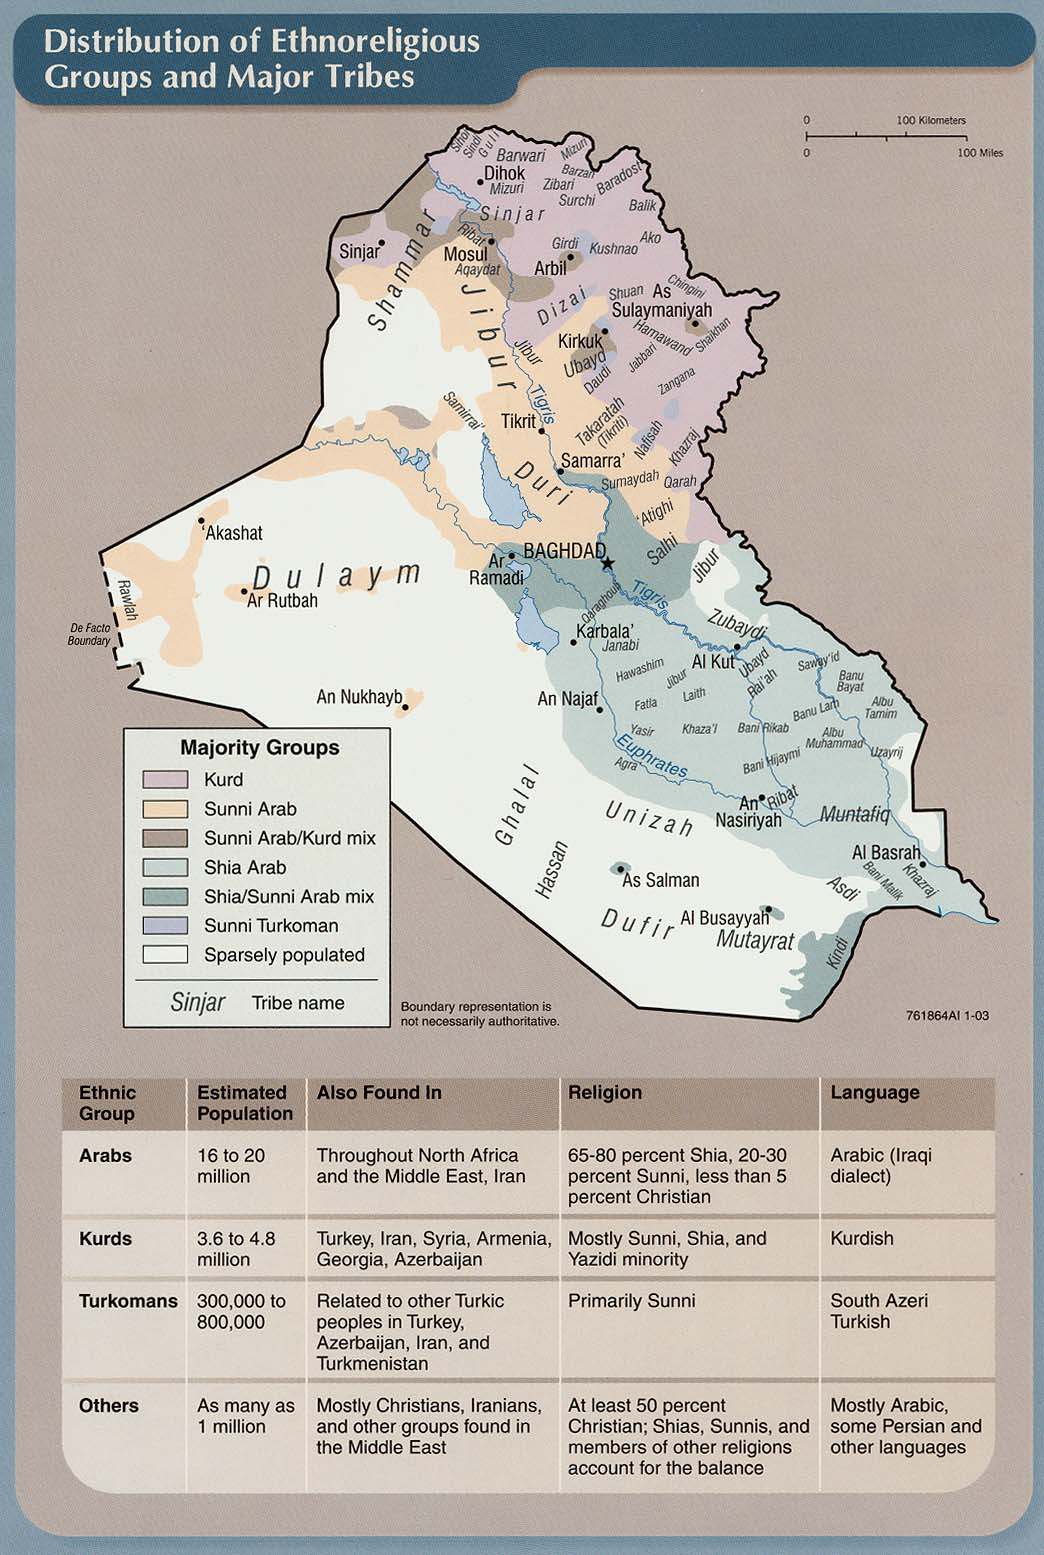
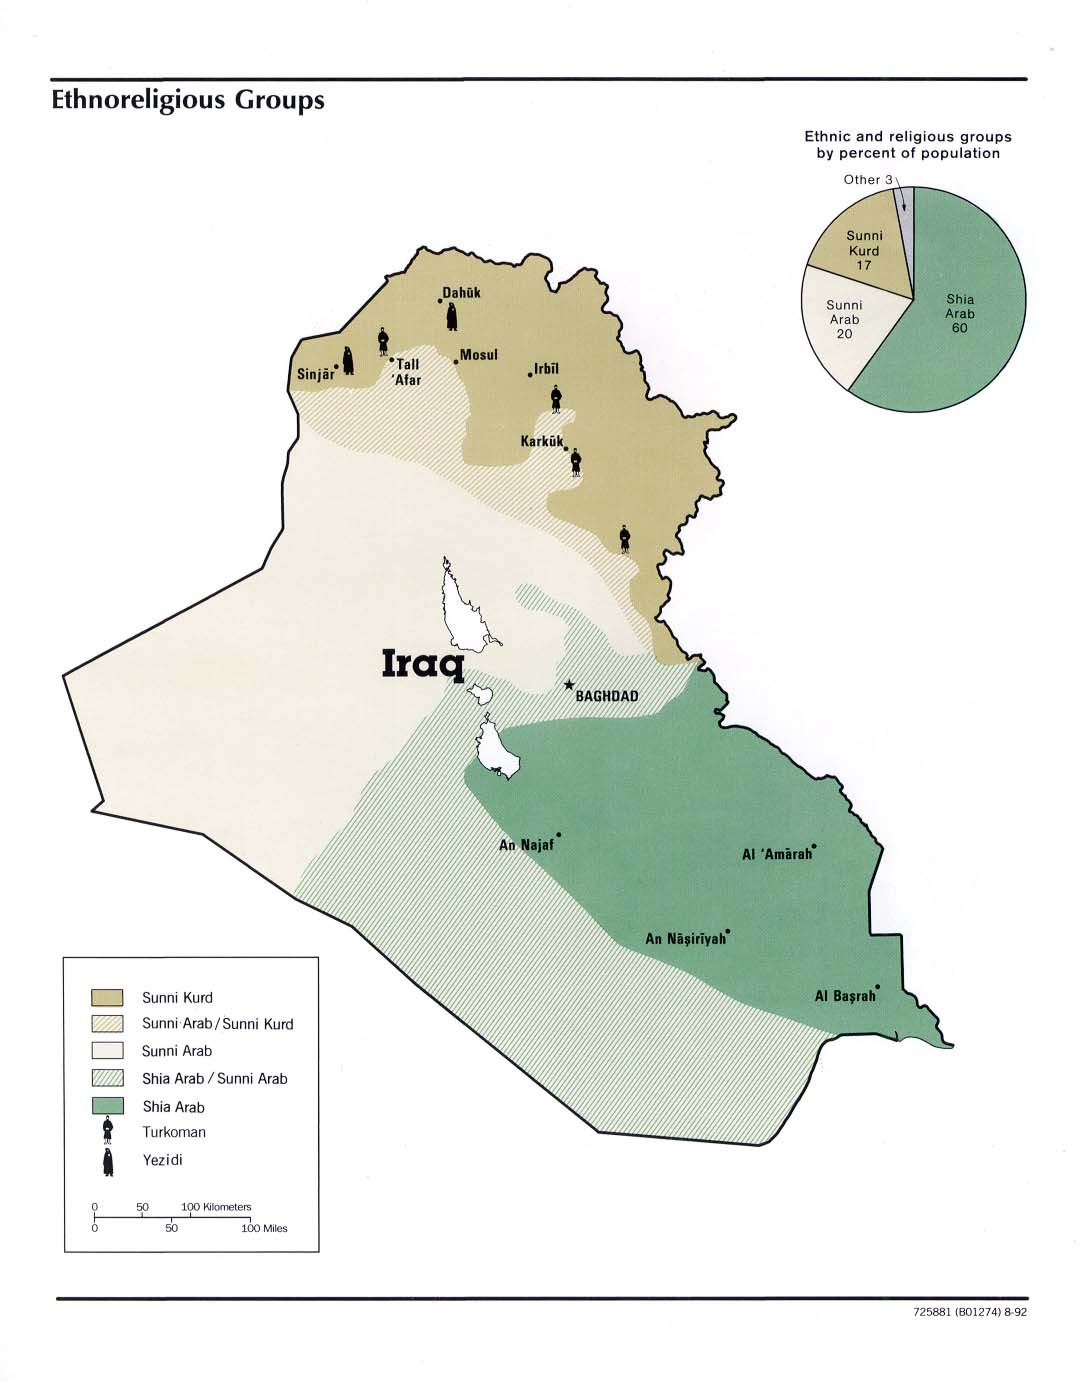
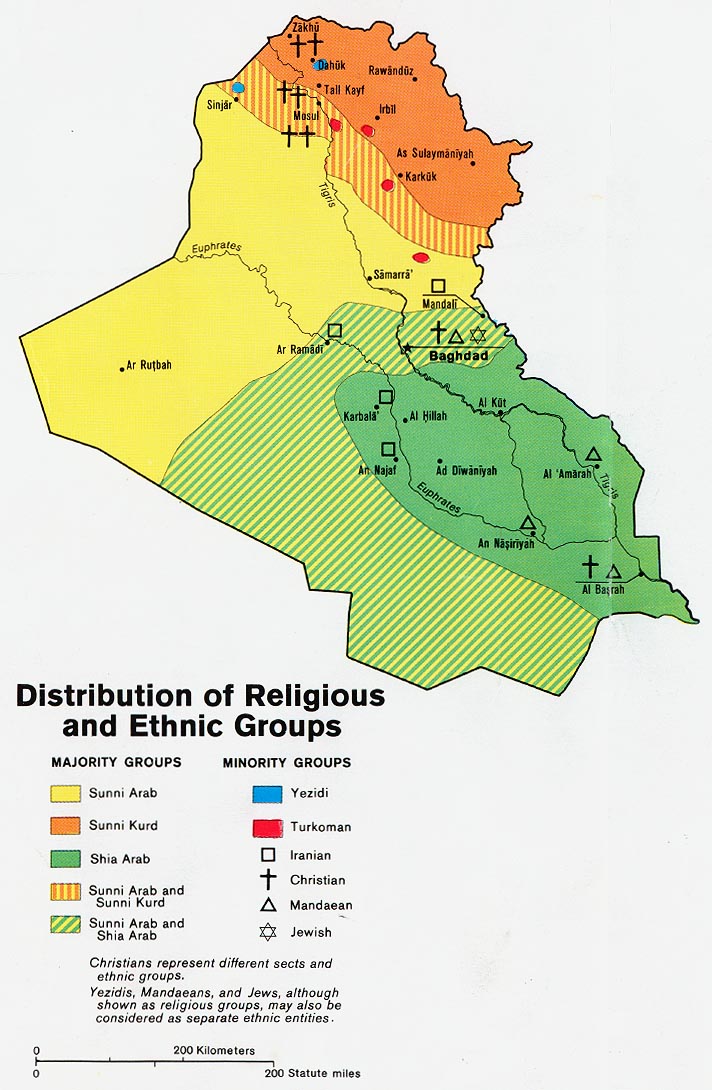
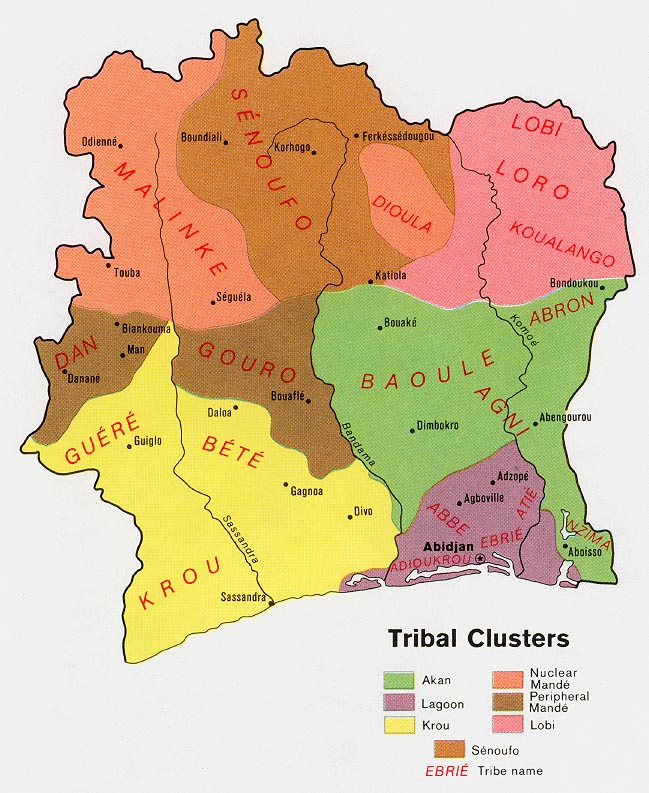
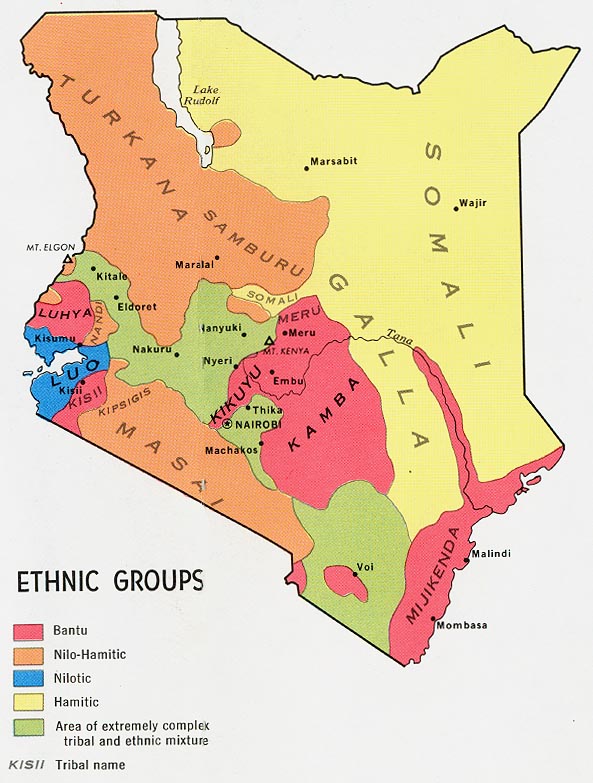
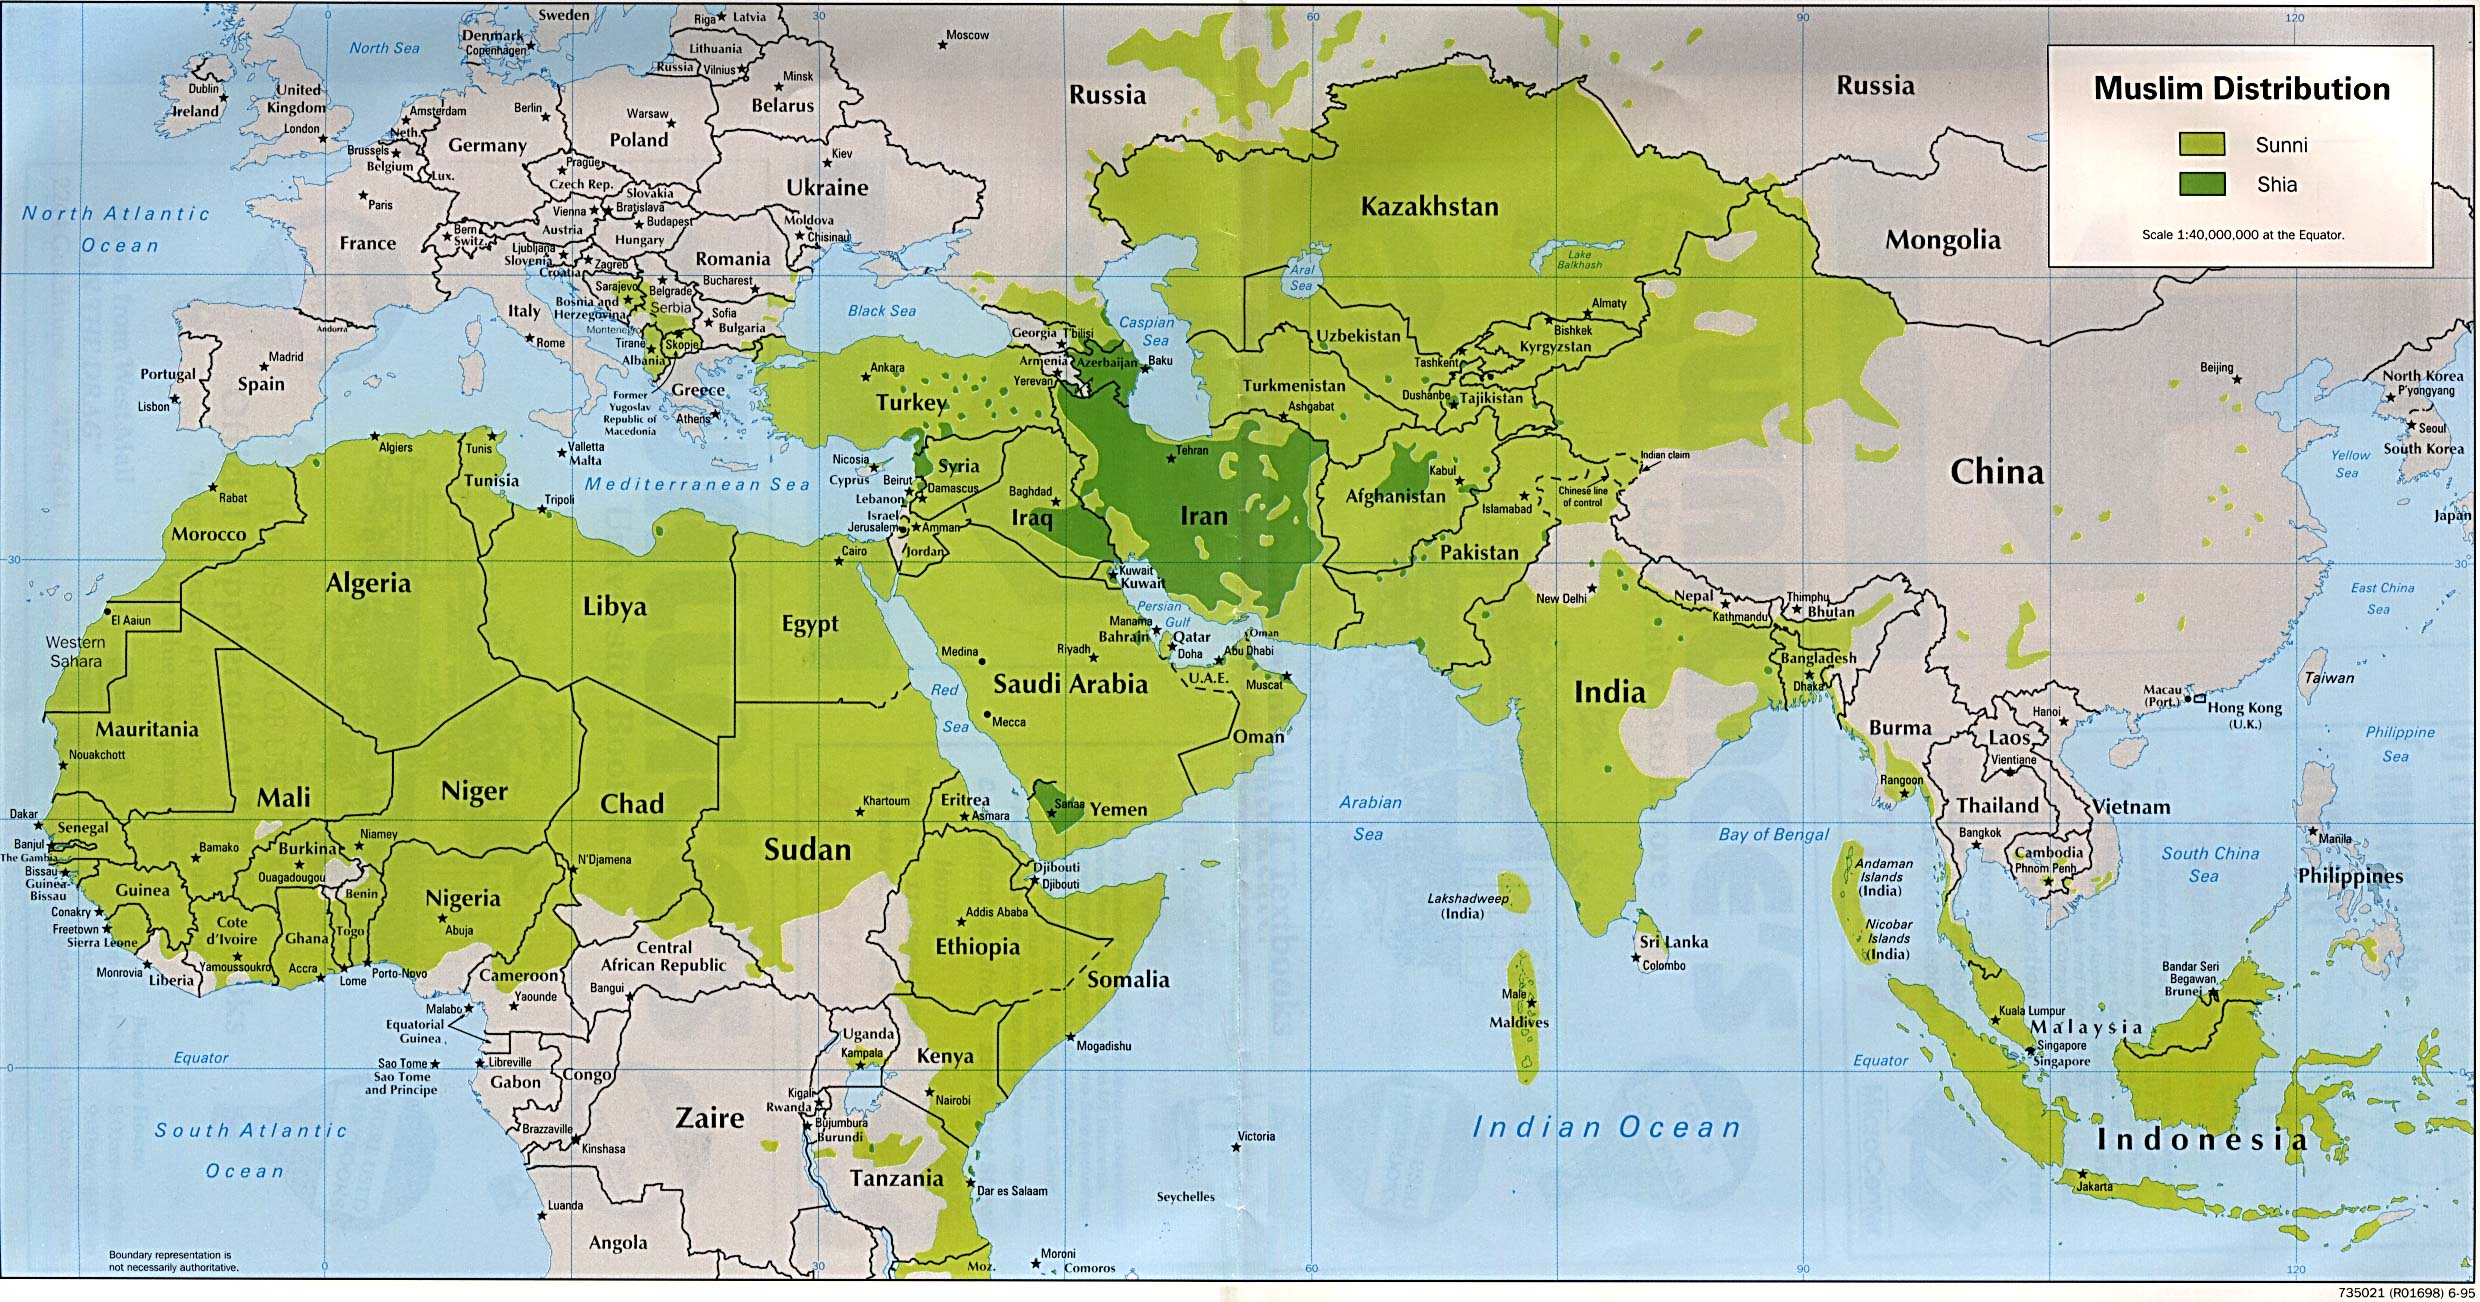
Ethnography and Religion
Industry and Economy
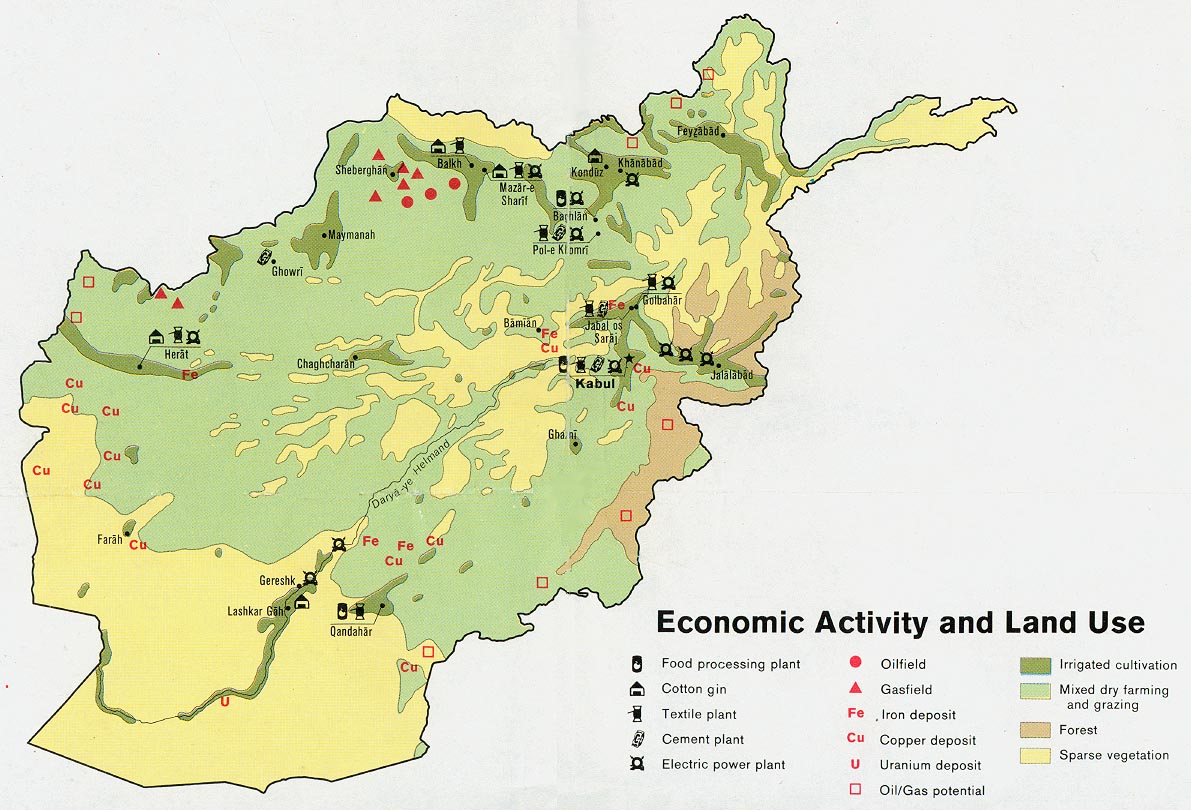
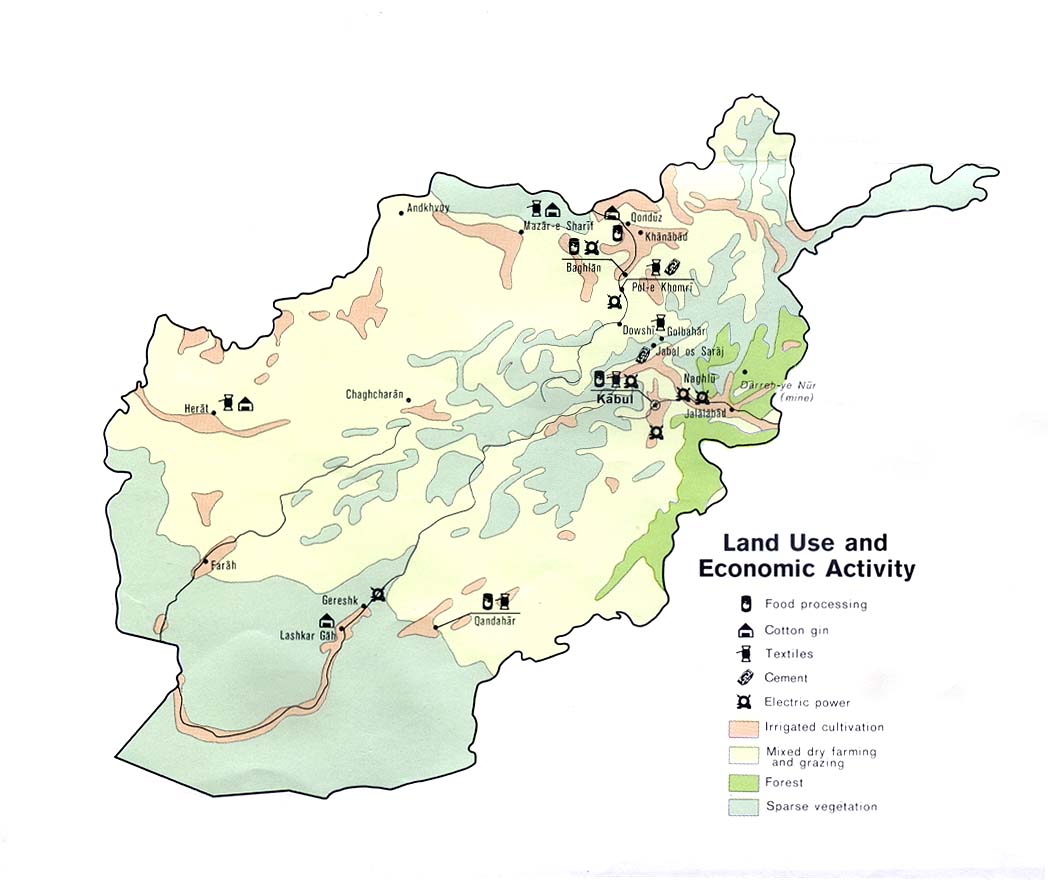
- Afghanistan - Economic Activity from Map No. 504958 1971 (203K)
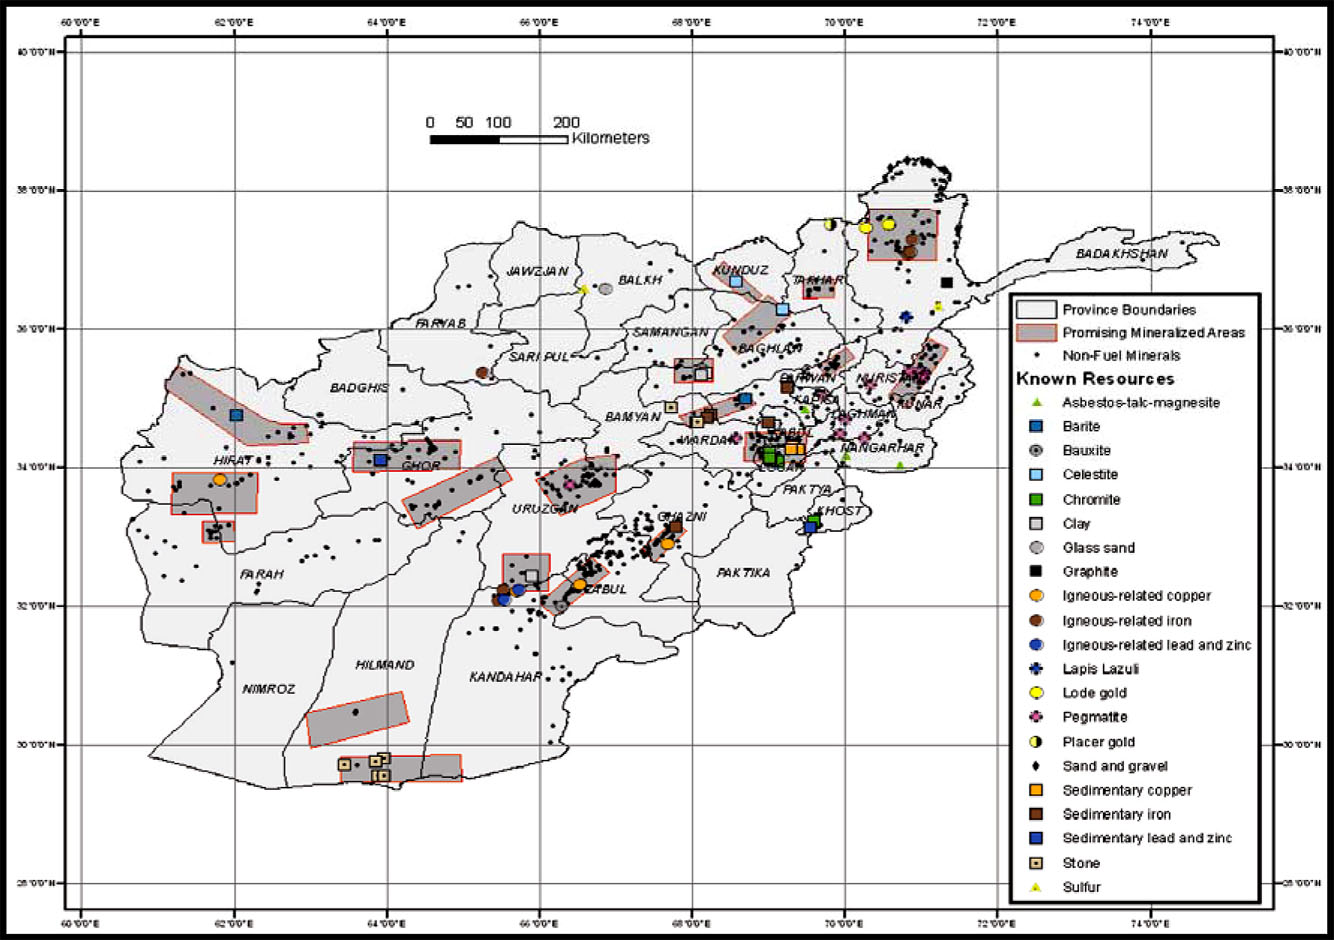
- Afghanistan - Known Resources from "Report on Progress Toward Security and Stability in Afghanistan", U.S. Dept. of Defense, June 2008 (254K)
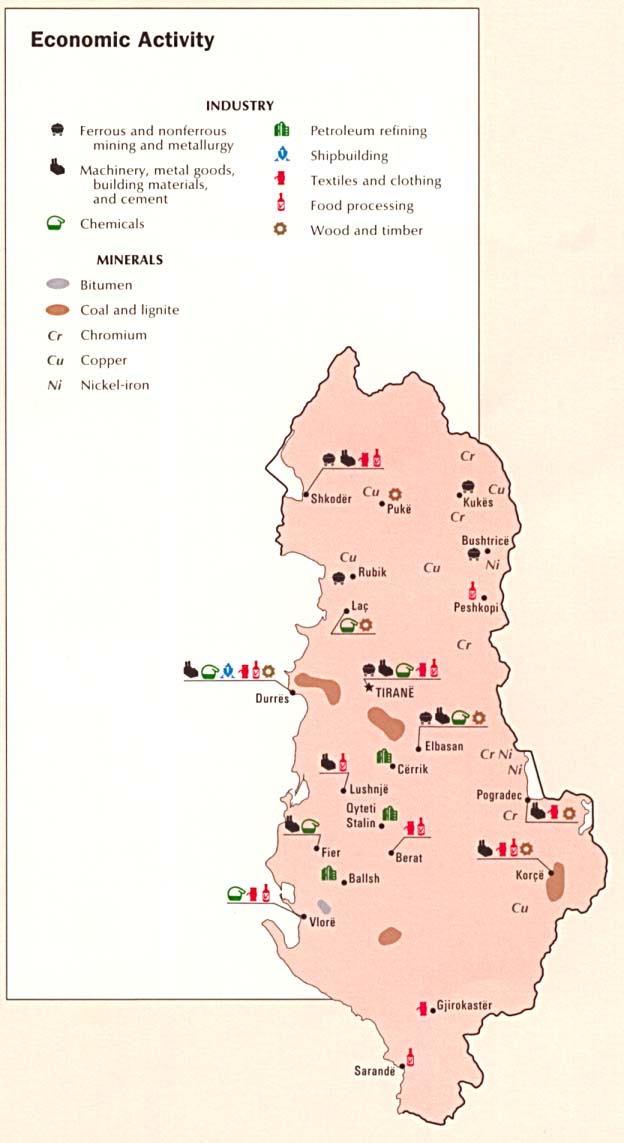
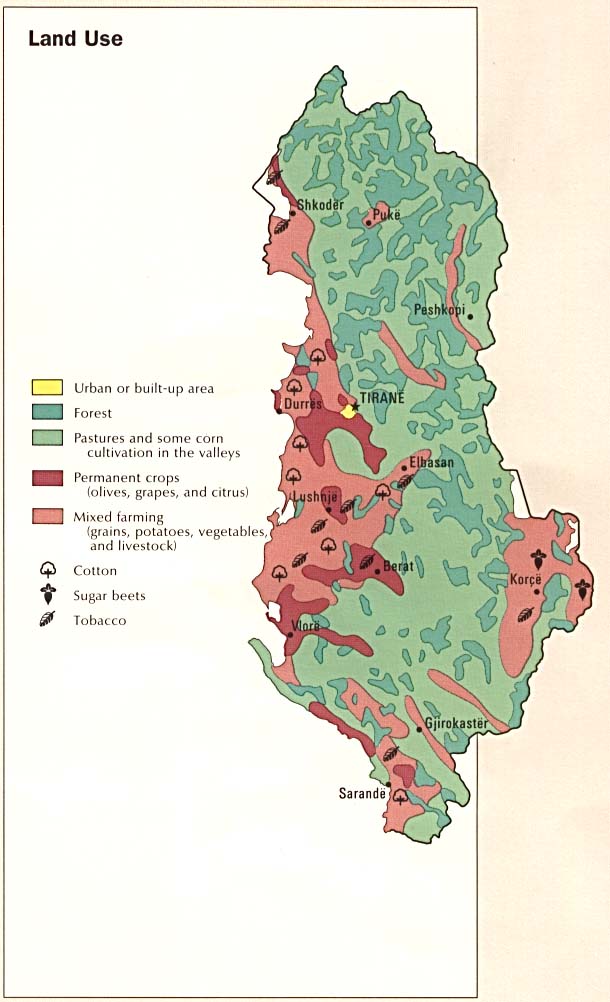
- Albania - Economic Activity from the CIA Atlas of Eastern Europe 1990 (63K)
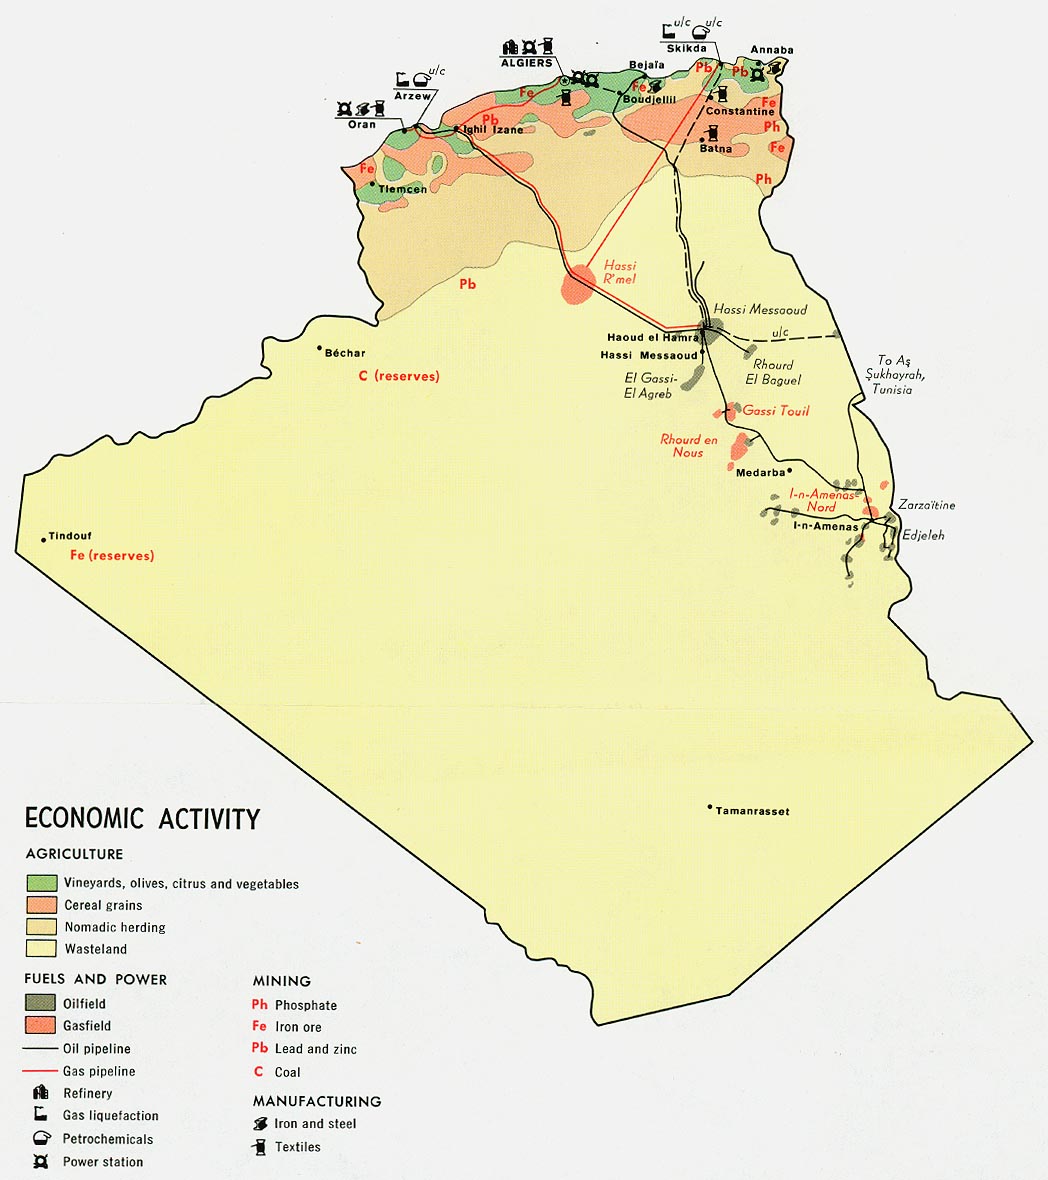
- Algeria - Economic Activity from Map No. 78692 1971 (154K)
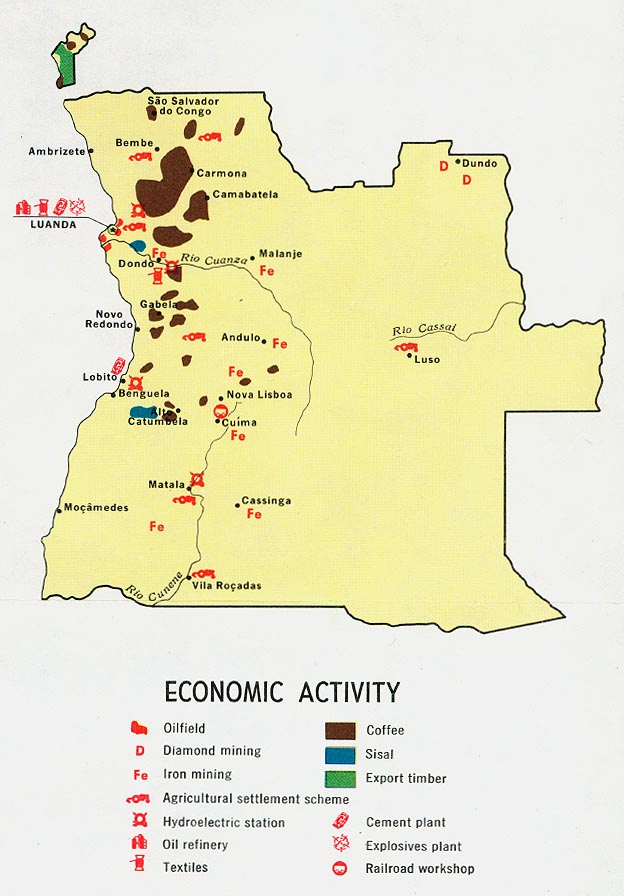
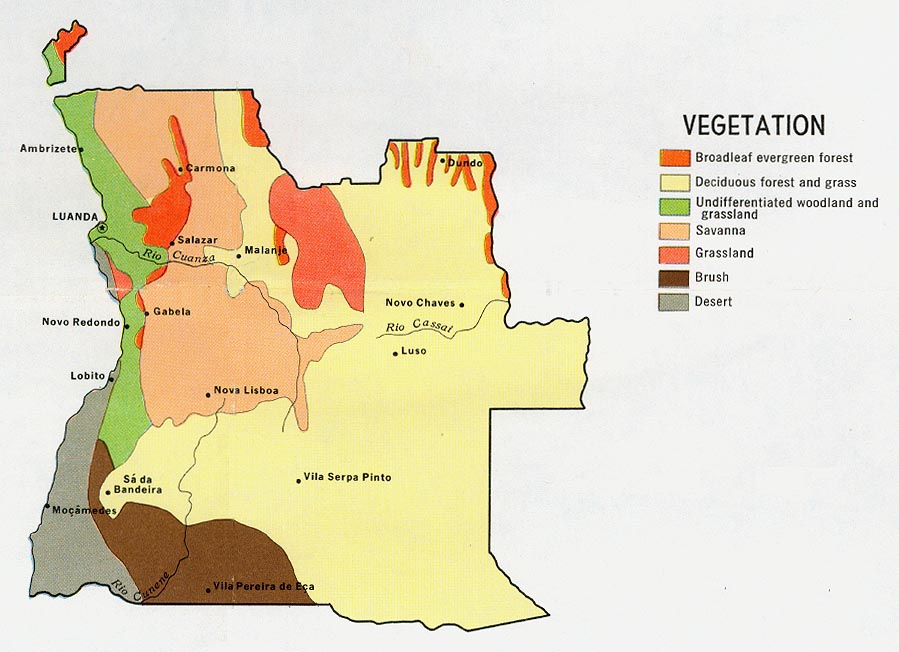
- Angola - Economic Activity from Map No. 77961 1973 (100K)
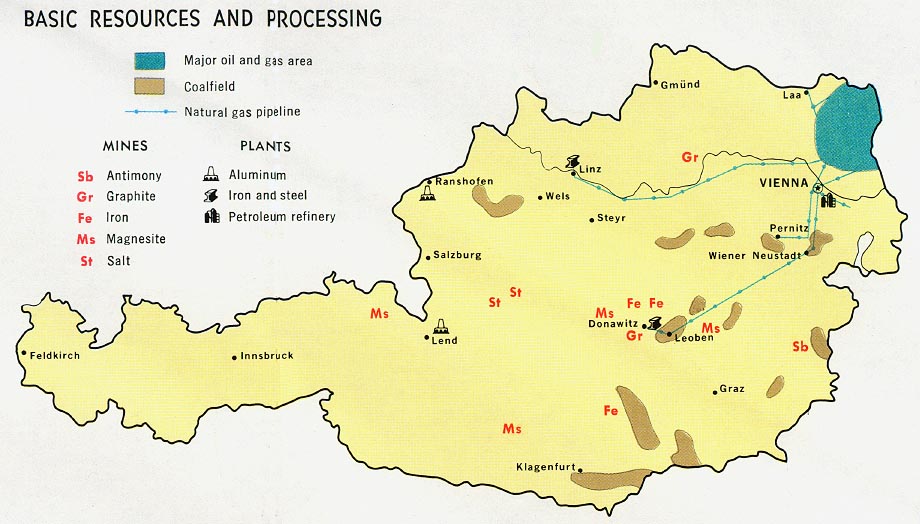
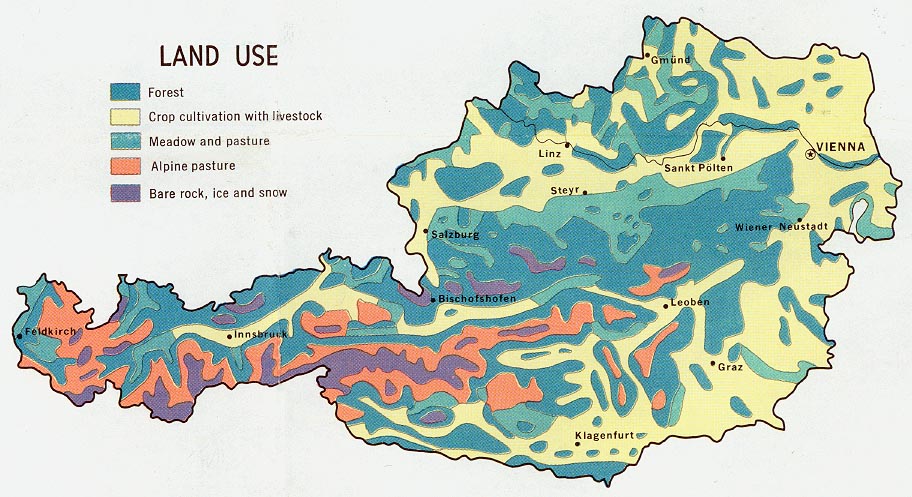
- Austria - Basic Resources and Processing from Map No. 77706 1969 (109K)
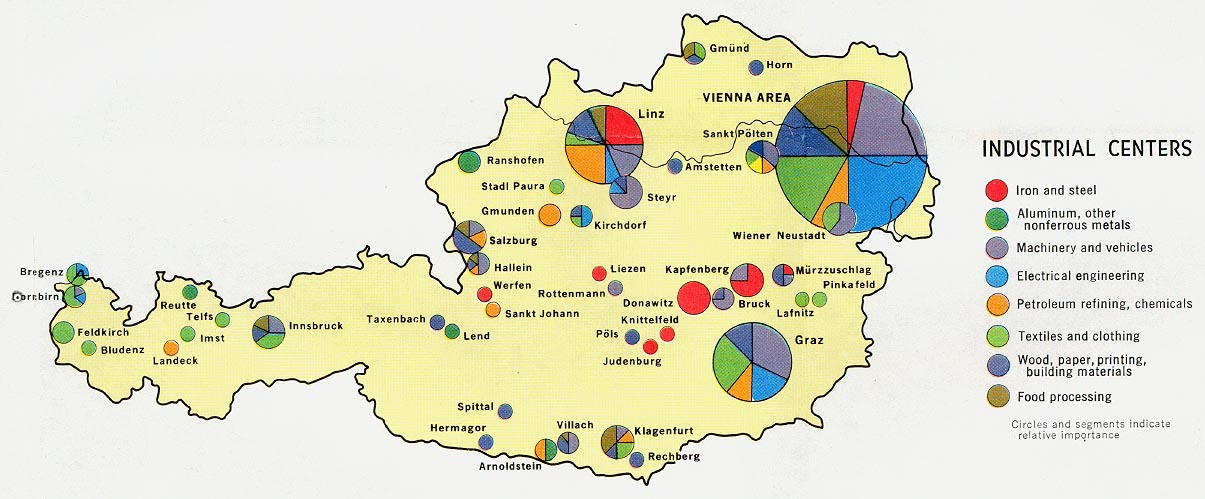
- Austria - Industrial Centers from Map No. 77706 1969 (135K)
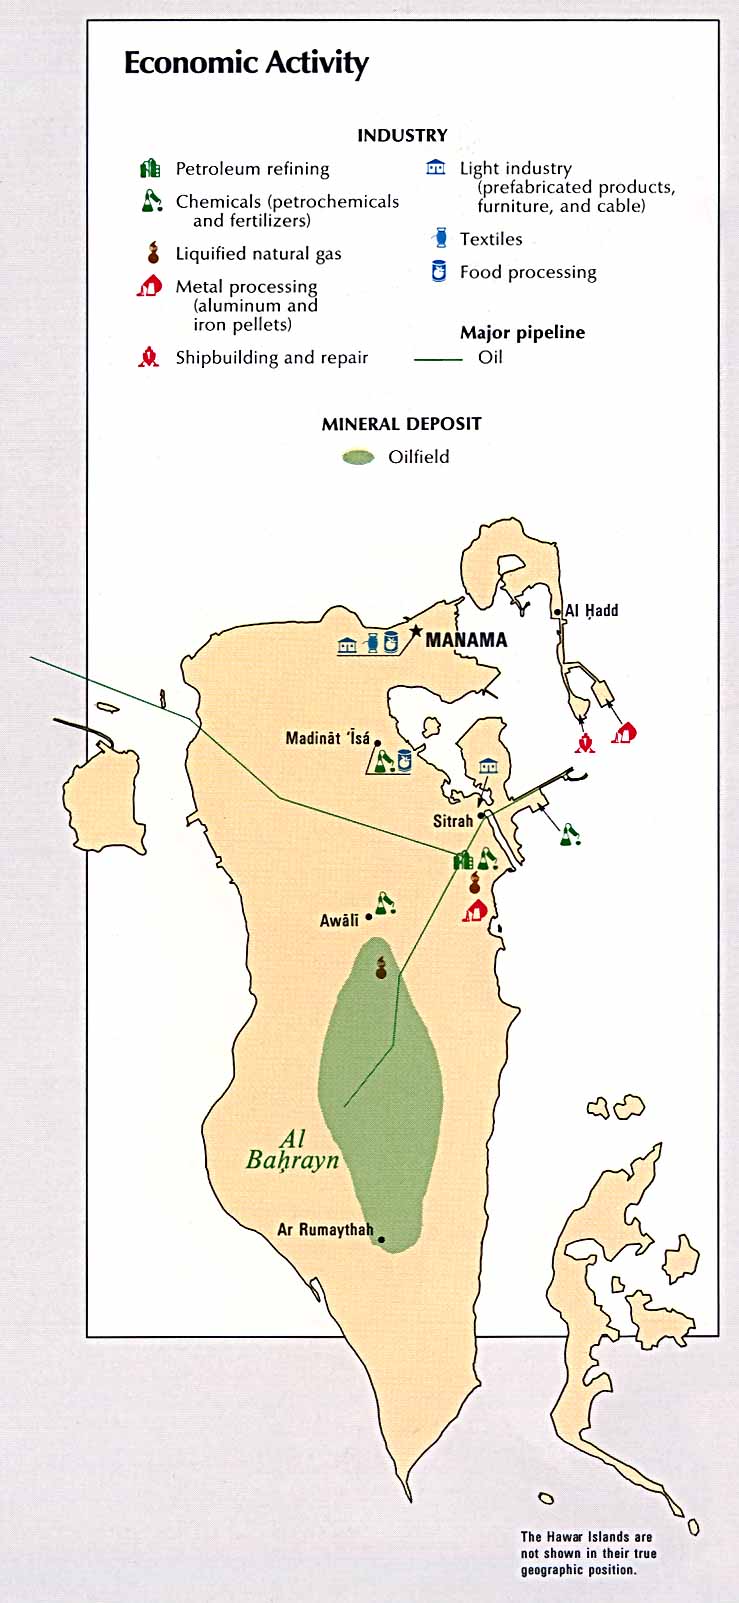
- Bahrain - Economic Activity from the CIA Atlas of the Middle East 1993 (104K)
- Belgium - Economic Activity from Map No. 75519 1968 (87K)
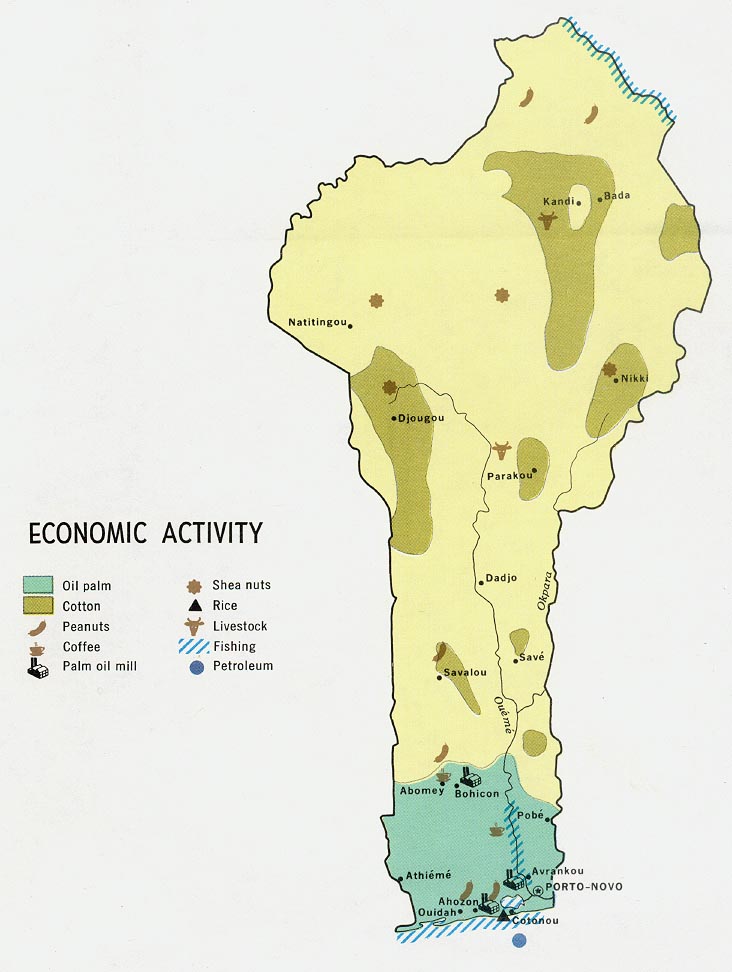
- Benin - Economic Acticity from Map No. 77258 1970 (95K)
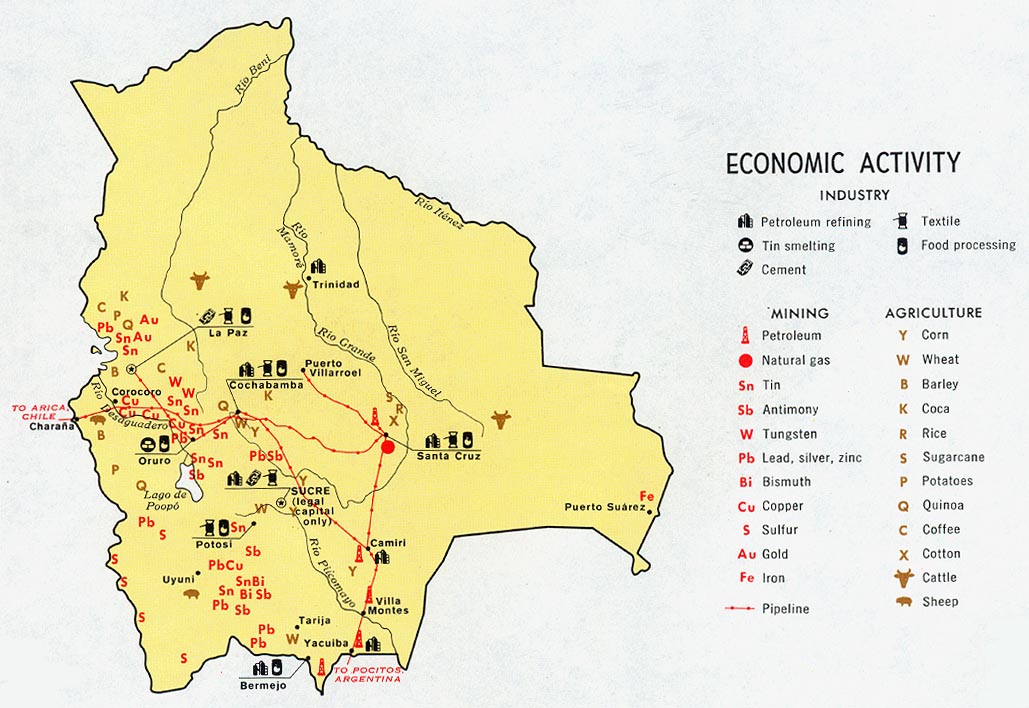
- Bolivia - Economic Activity from Map No. 78499 1971 (147K)
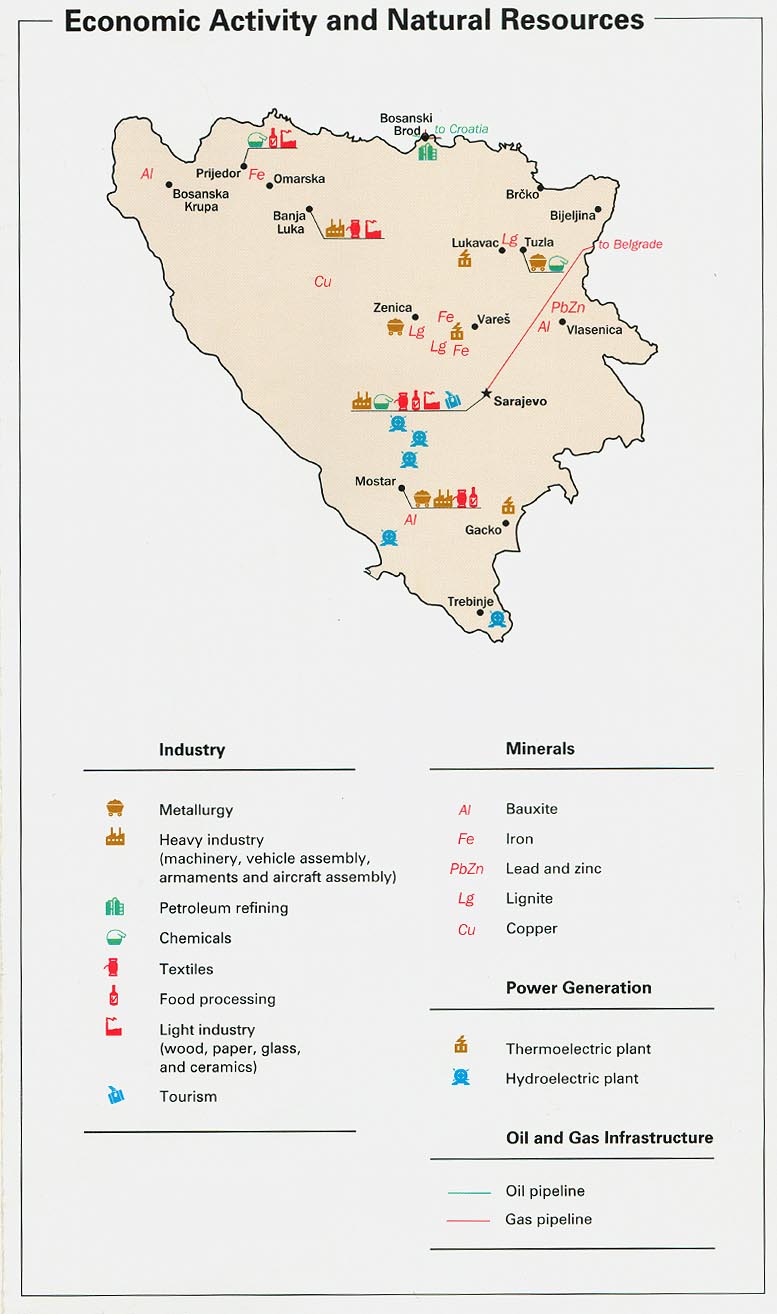
- Bosnia and Herzegovina - Economic Activity and Natural Resources from Map No. 802172 1993 (115K)
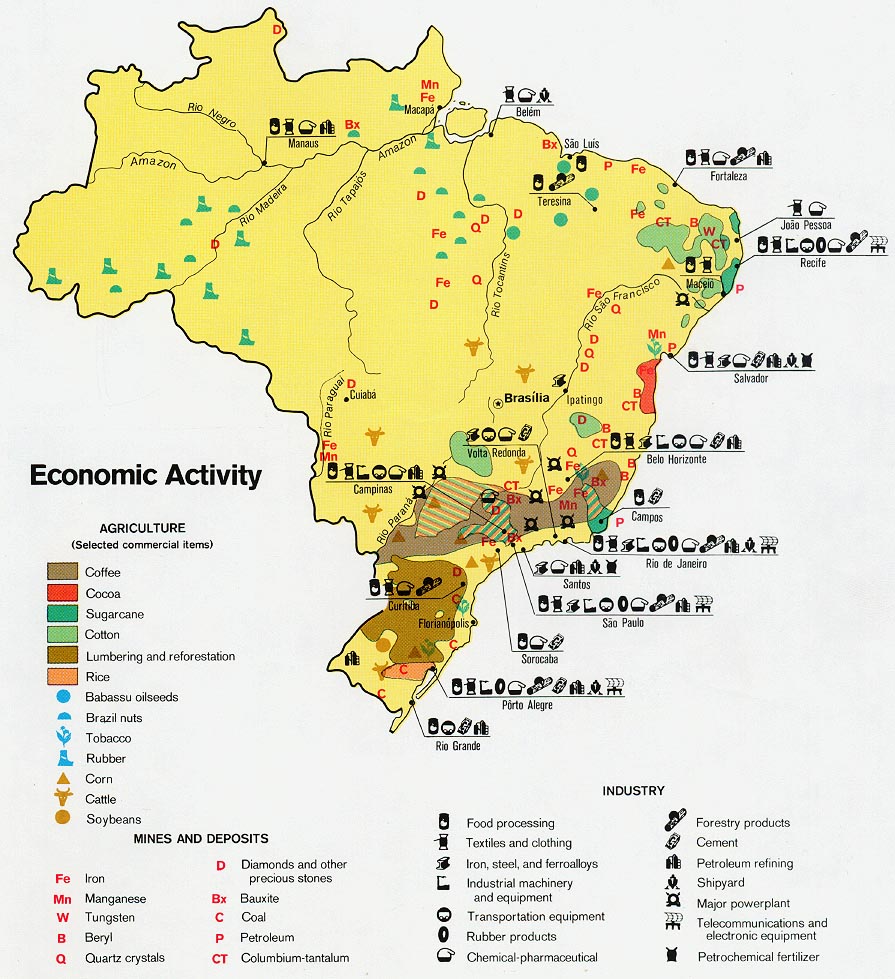
- Brazil - Economic Activity from Map No. 503241 1977 (210K)
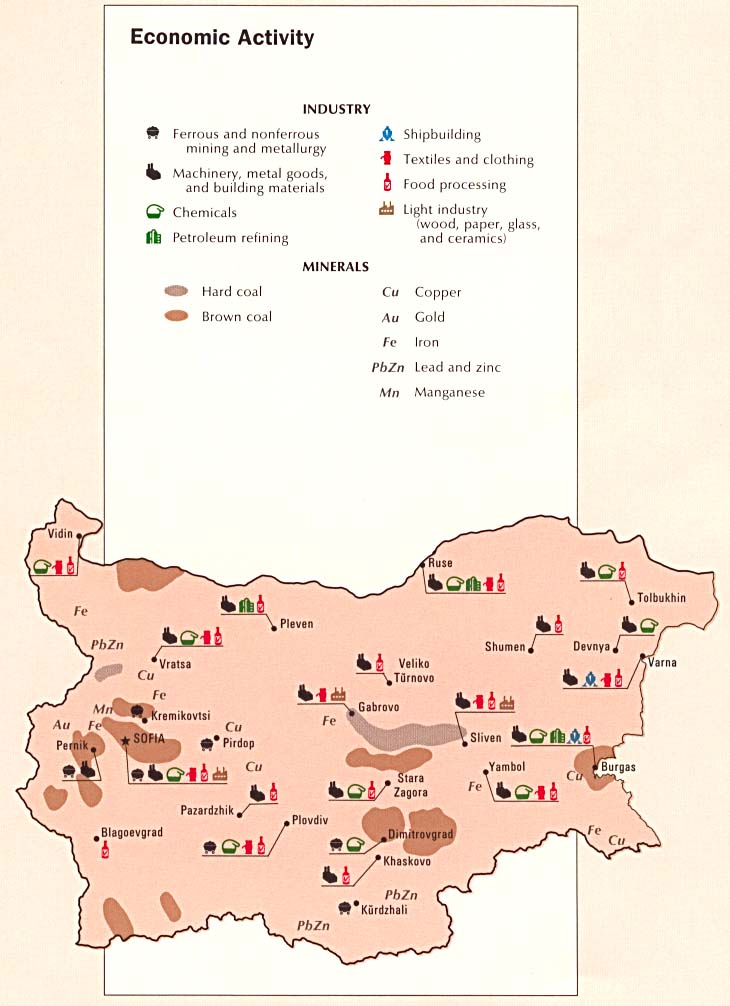
- Bulgaria - Economic Activity from the CIA Atlas of Eastern Europe 1990 (85K)
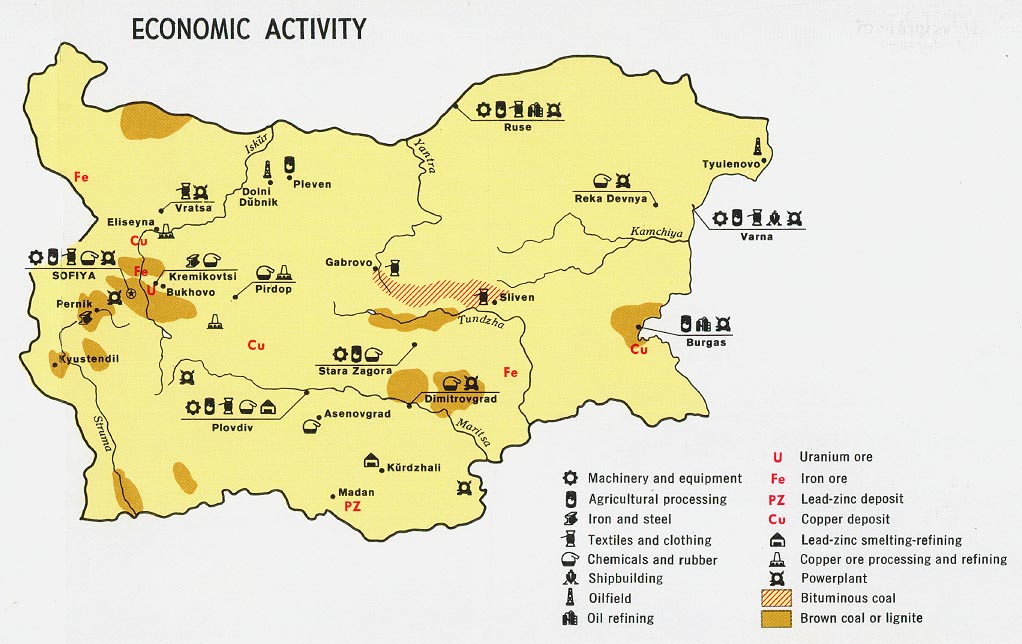
- Bulgaria - Economic Activity from Map No. 500252 1972 (131K)
- [Burkina Faso] Upper Volta - Economic Activity from Map No. 58207 1968 (94K)
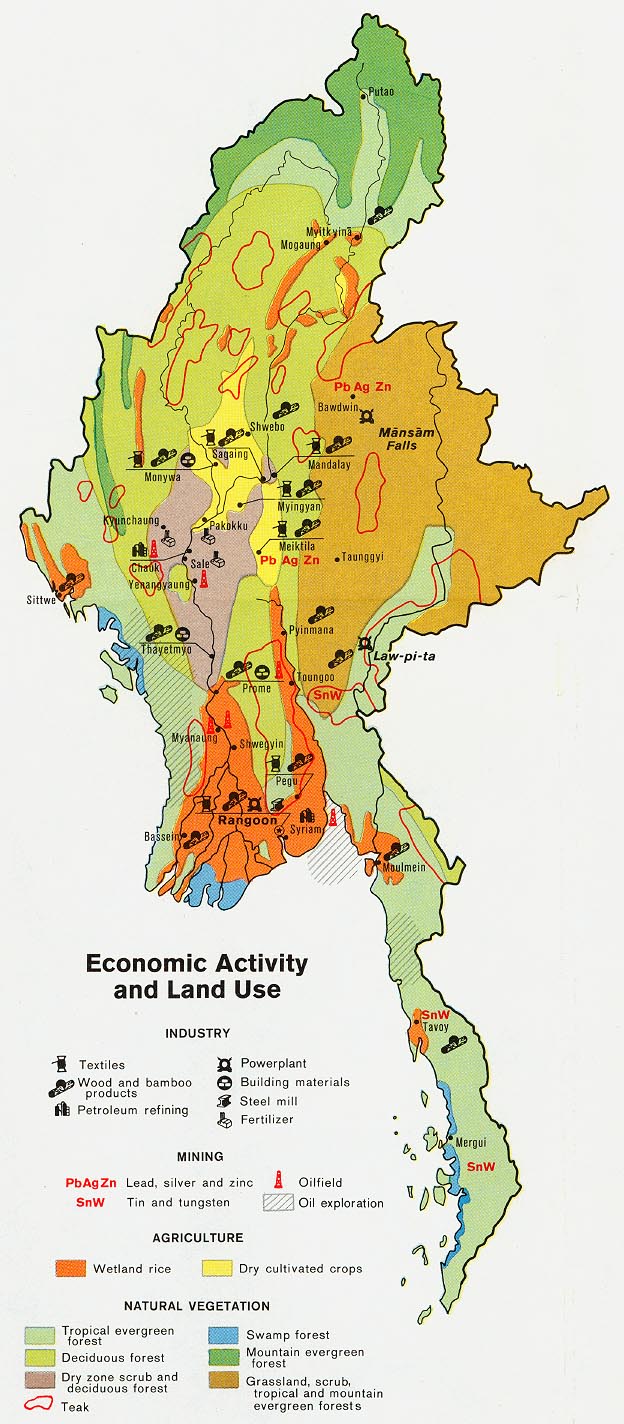
- Burma - Economic Activity and Land Use from Map No. 500425 1972 (192K)
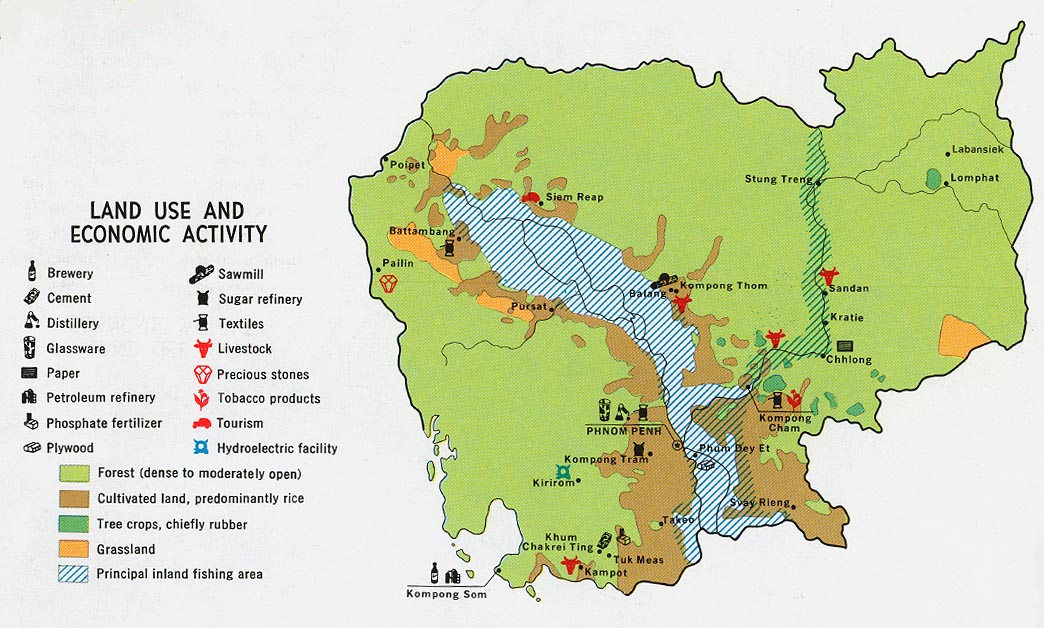
- Cambodia - Economic Activity and Land Use from Map No. 77967 1972 (192K)
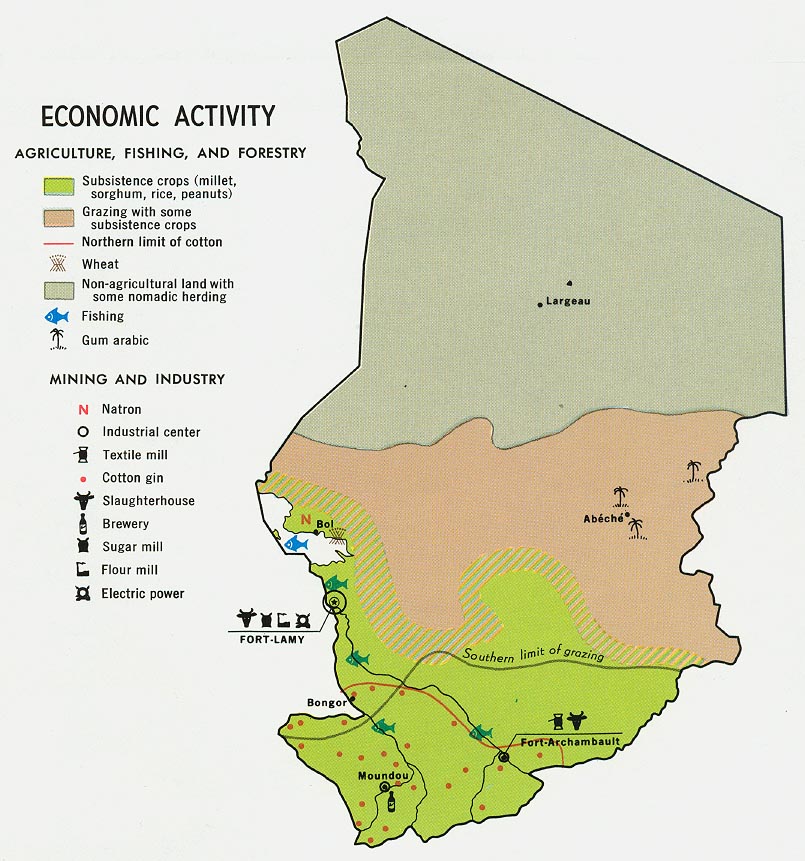
- Chad - Economic Activity from Map No. 59886 1969 (158K)
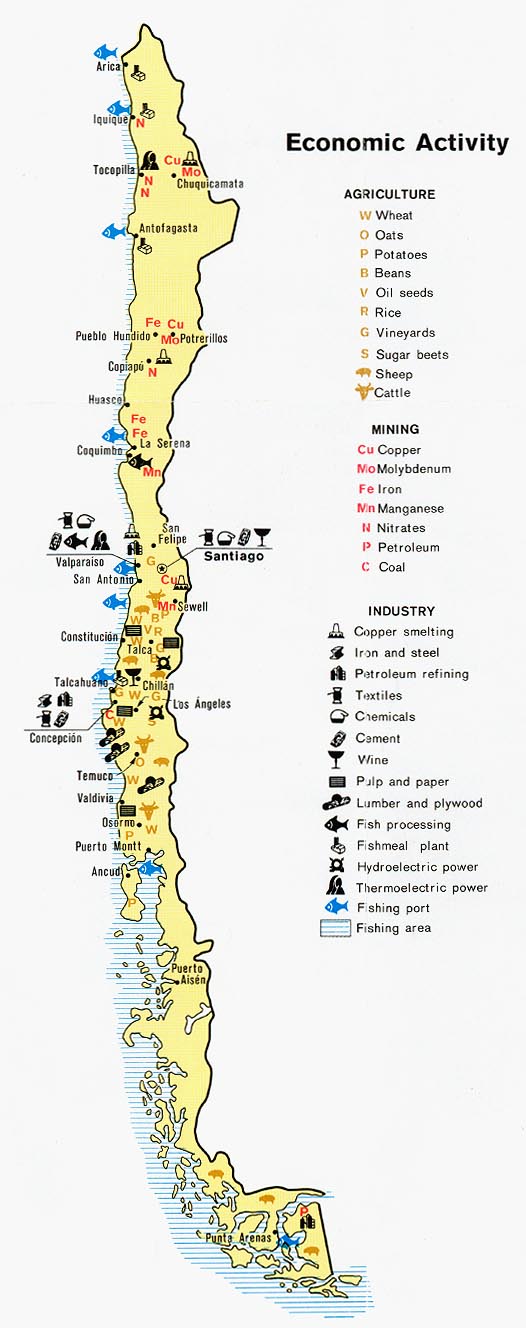
- Chile - Economic Activity from Map No. 500814 1972 (114K)
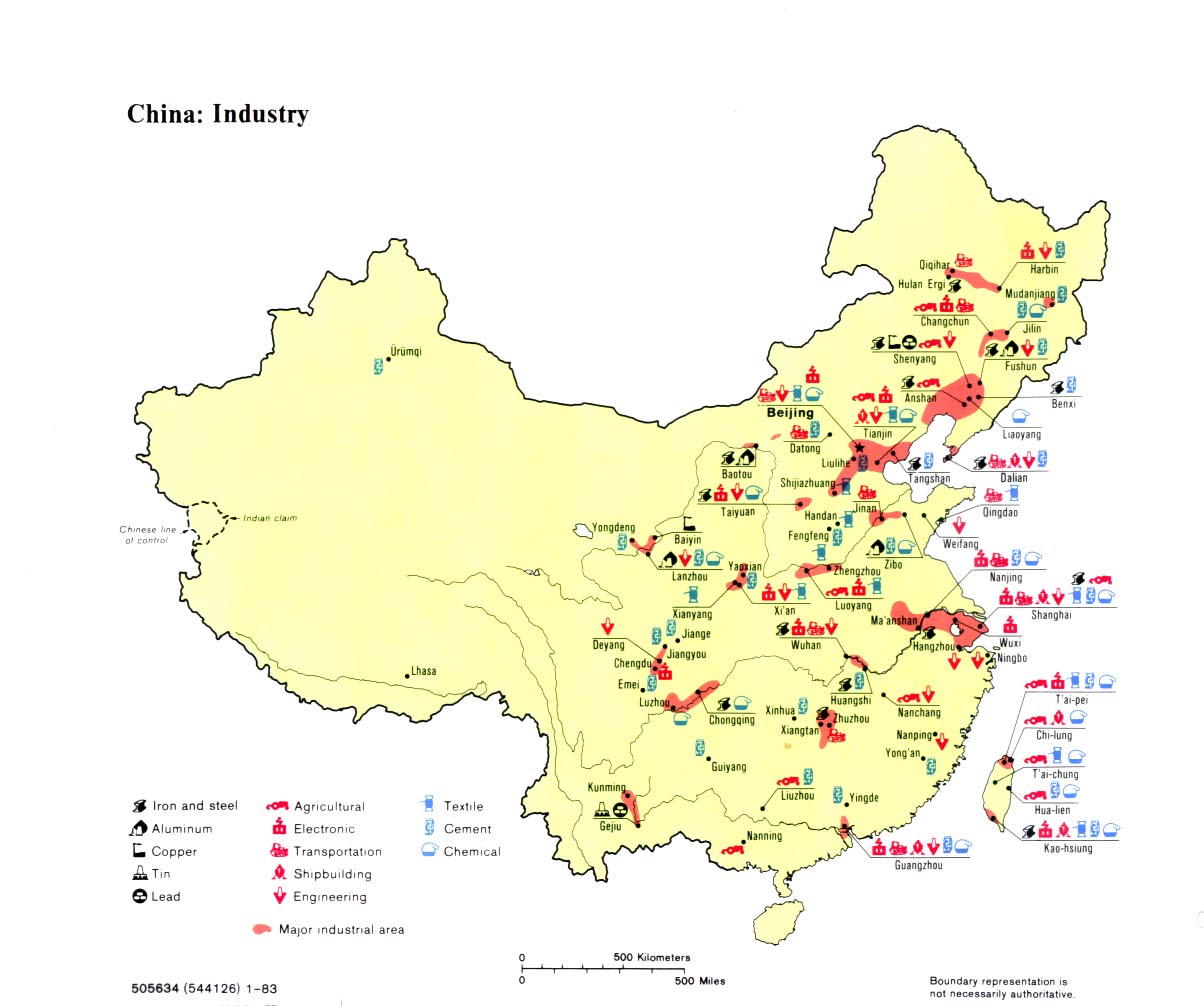
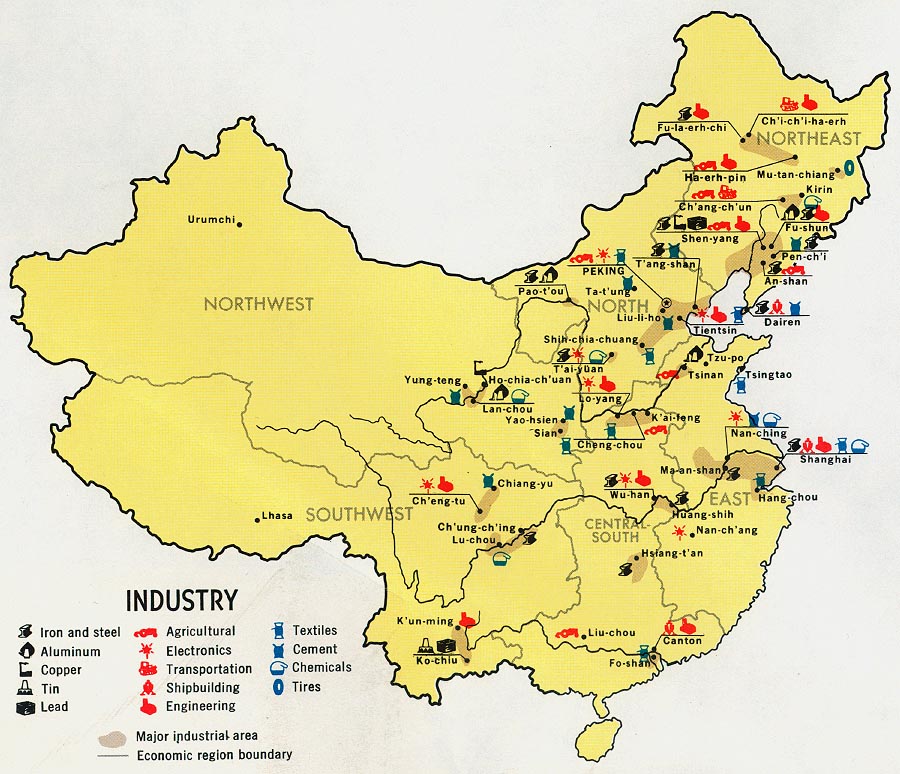
- China - Industry 1983 (258K)
- China - Industry from Map No. 500410 1971 (182K)
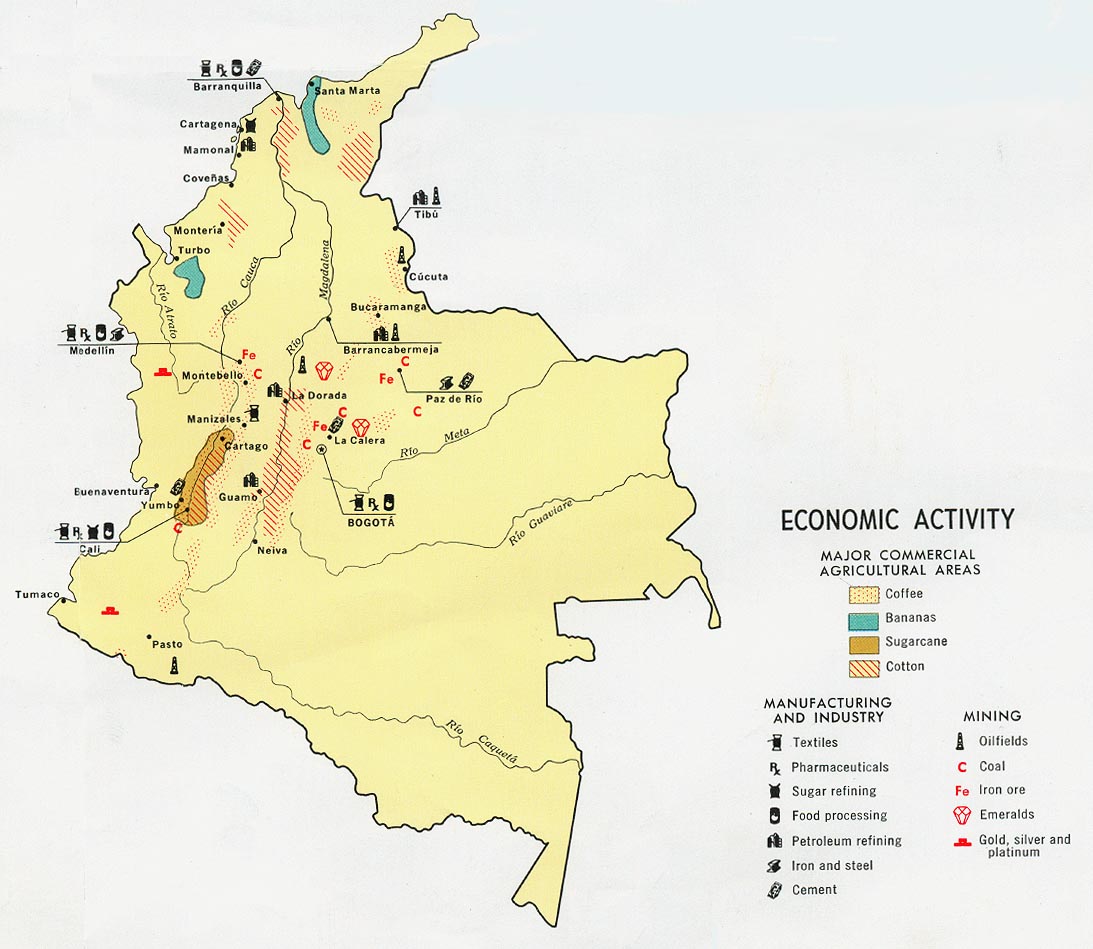
- Colombia - Economic Activity 1970 (148K)
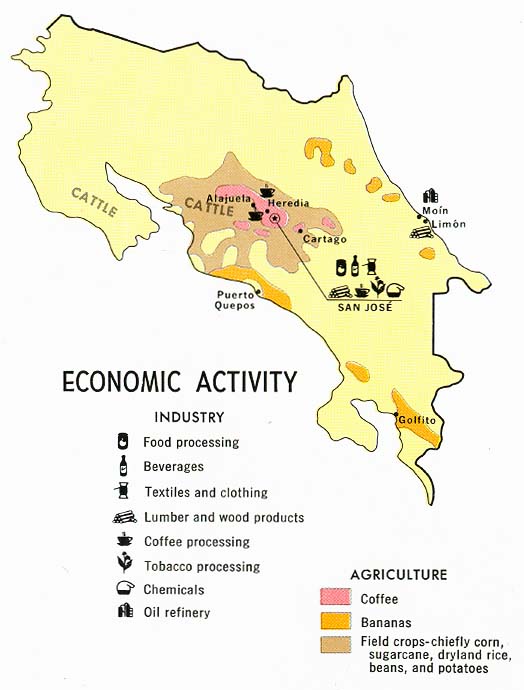
- Costa Rica - Economic Activity from Map No. 73665 1970 (148K)
- Croatia - Economic Activity from Map No. 802345 1996 (134K)
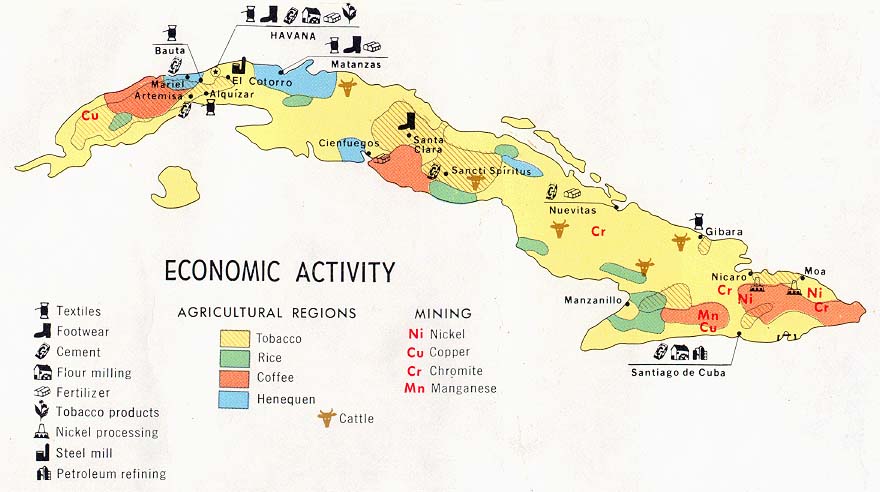
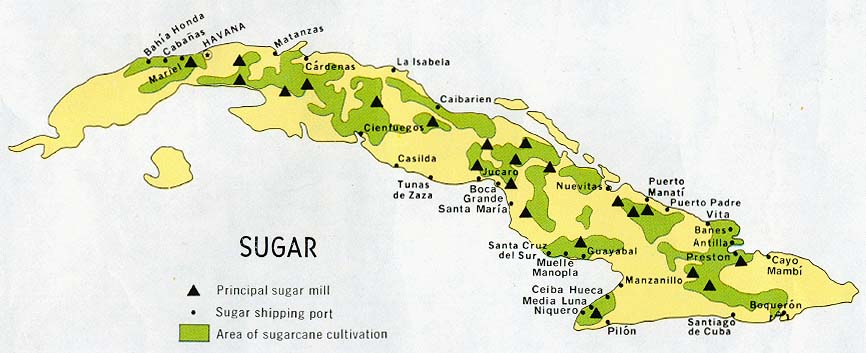
- Cuba - Economic Activity from Map No. 502988 1977 (84K)
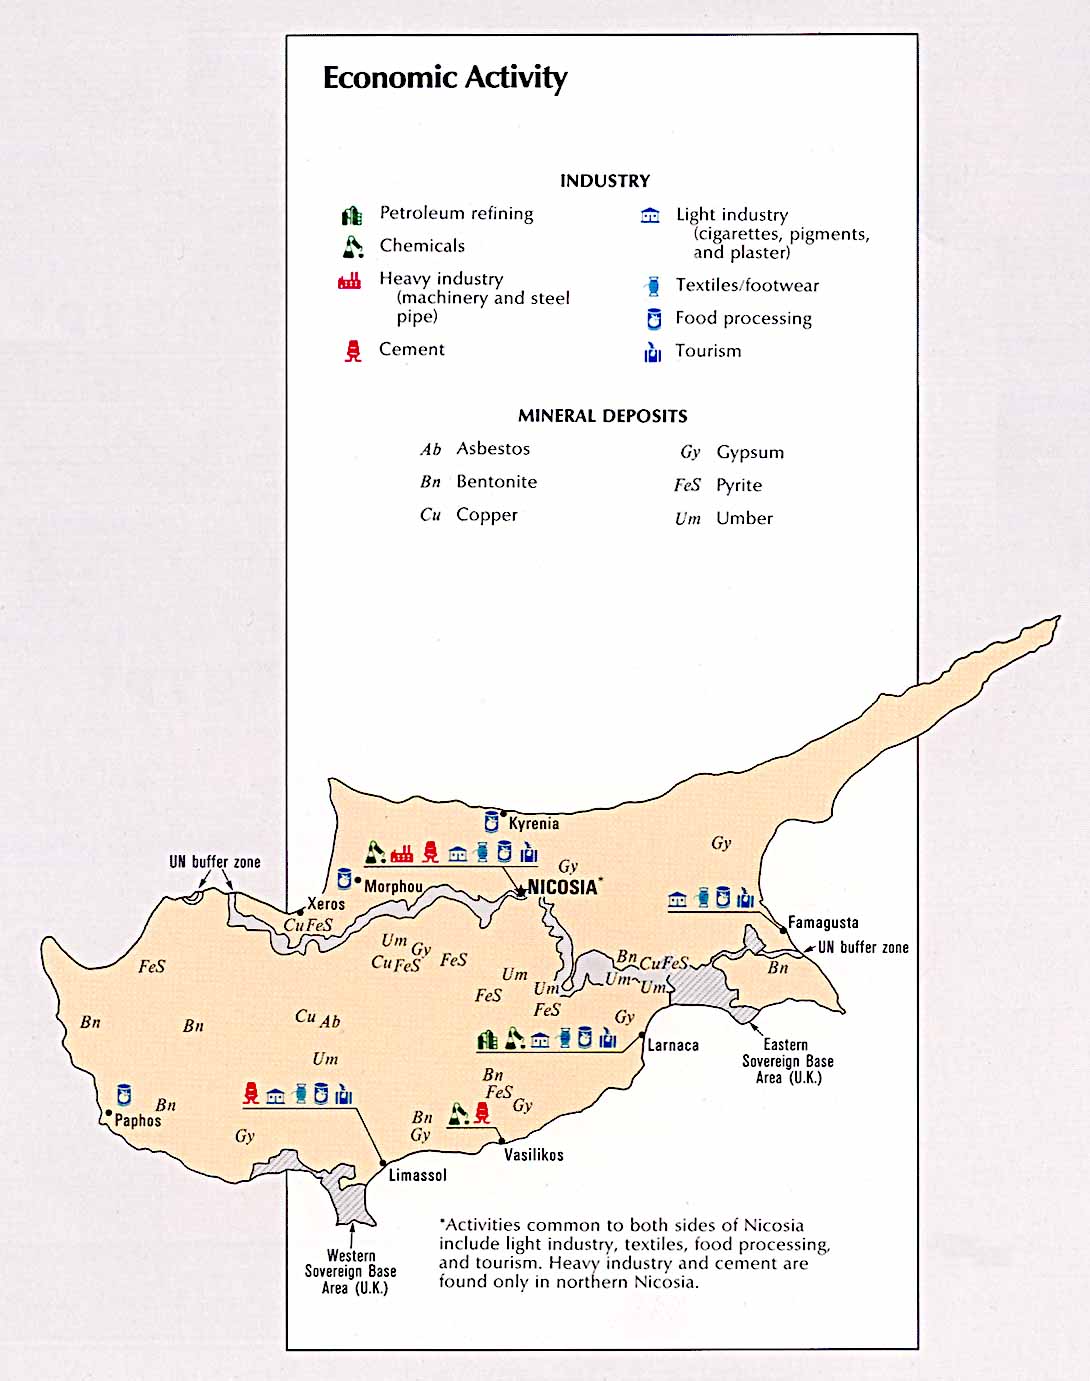
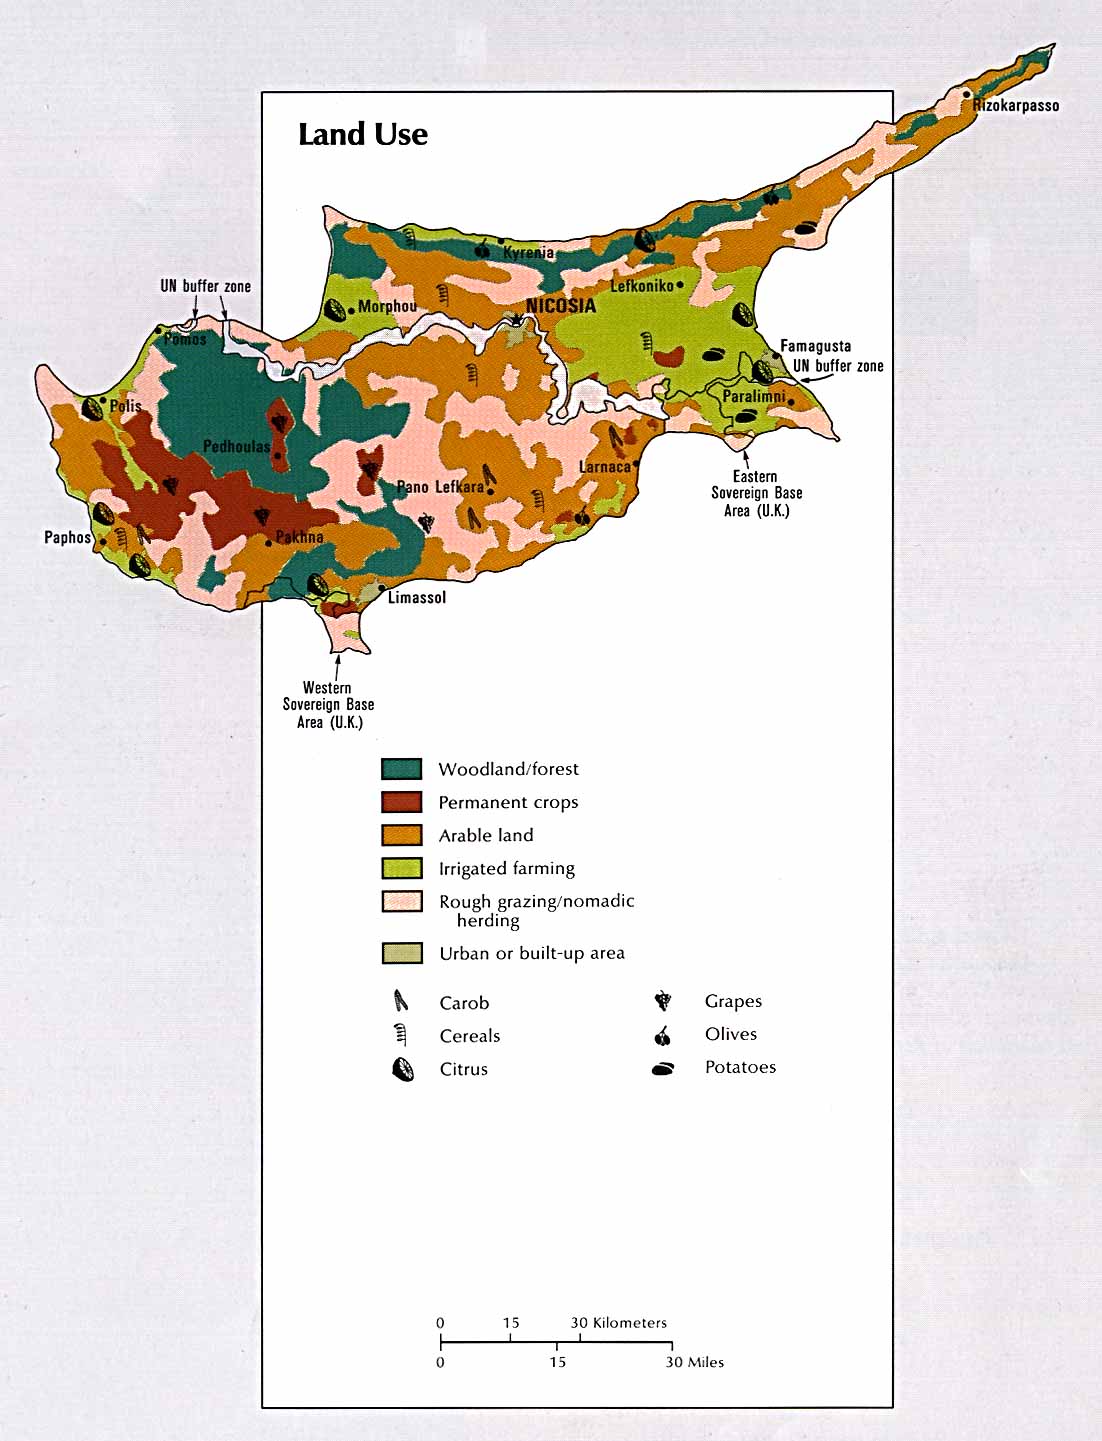
- Cyprus - Economic Activity from the CIA Atlas of the Middle East 1993 (121K)
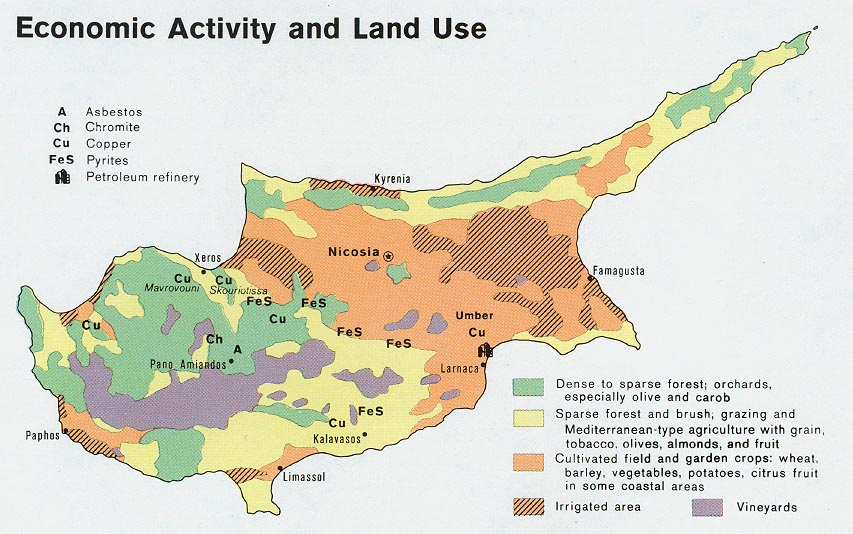
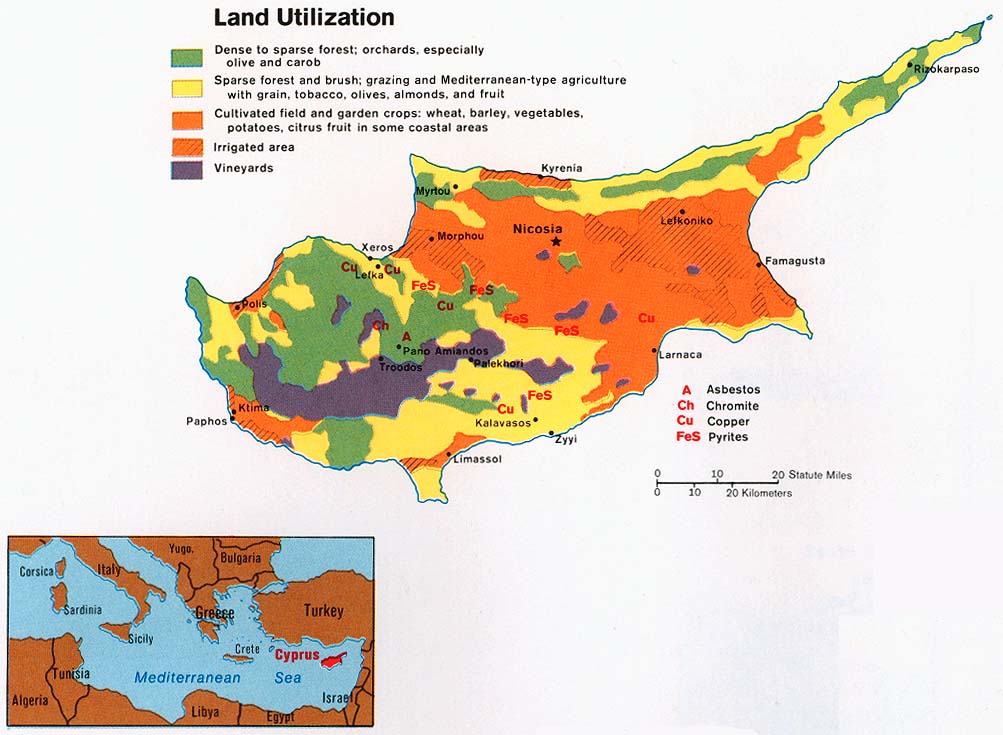
- Cyprus - Economic Activity and Land Use from Map No. 500862 1972 (129K)
- [Czech and Slovak Republics] Czechoslovakia - Economic Activity from the CIA Atlas of Eastern Europe 1990 (120K)
- [Czech and Slovak Republics] Czechoslovakia - Industries from Map No. 501820 1974 (140K)
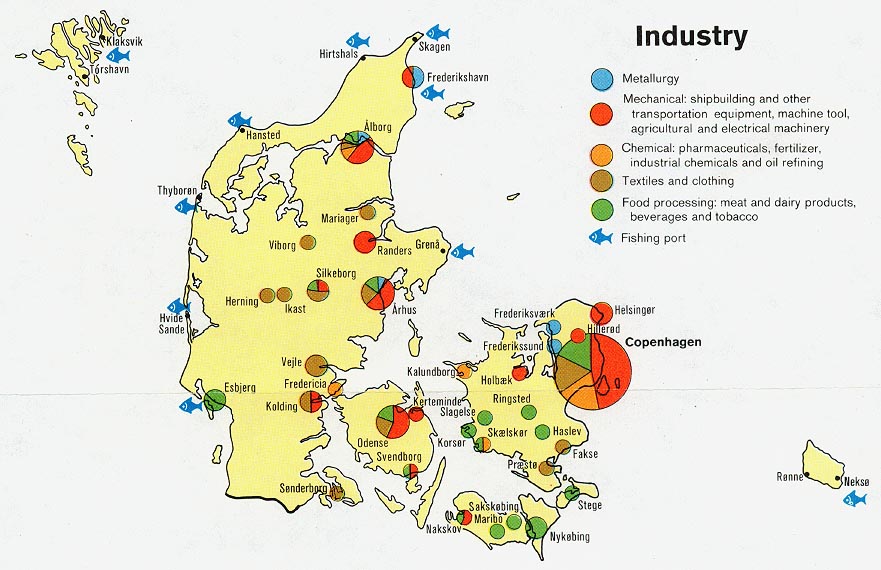
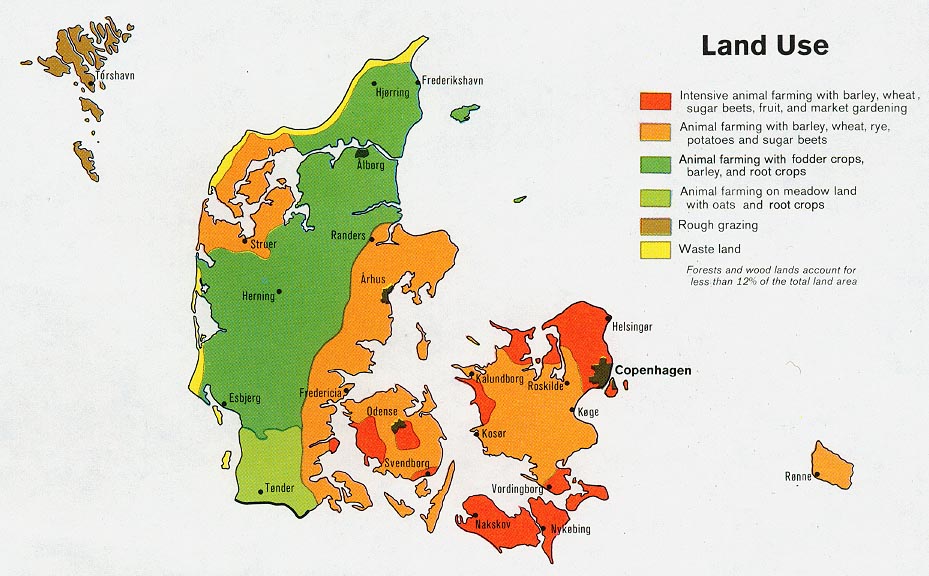
- Denmark - Industry from Map No. 501760 1974 (128K)
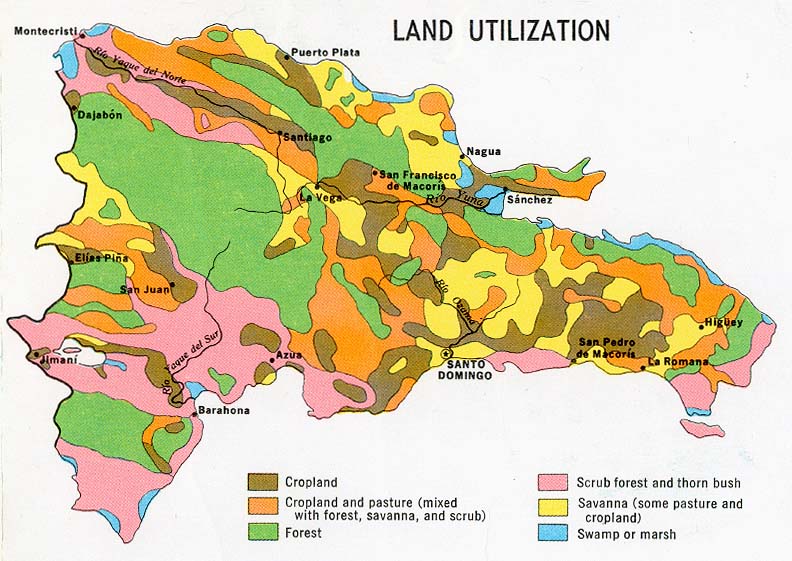
- Dominican Republic - Economic Activity from Map No. 78962 1971 (107K)
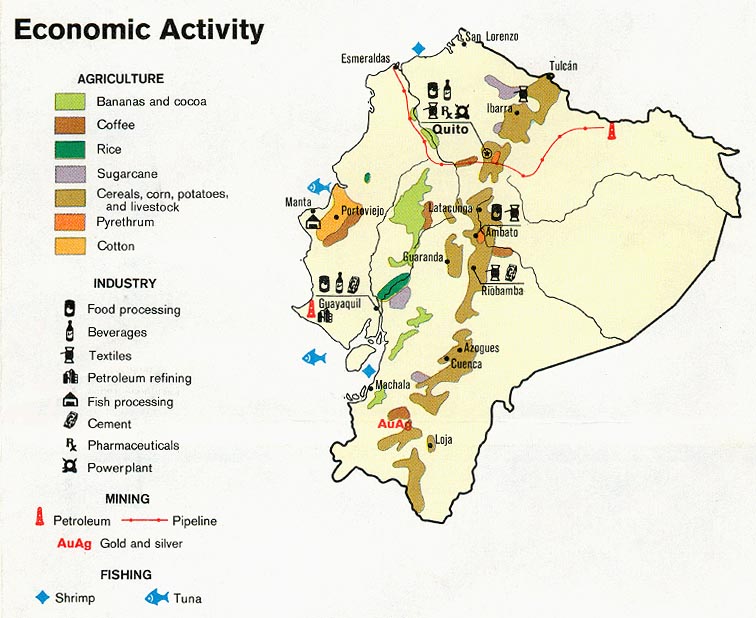
- Ecuador - Economic Activity from Map No. 501177 1973 (109K)
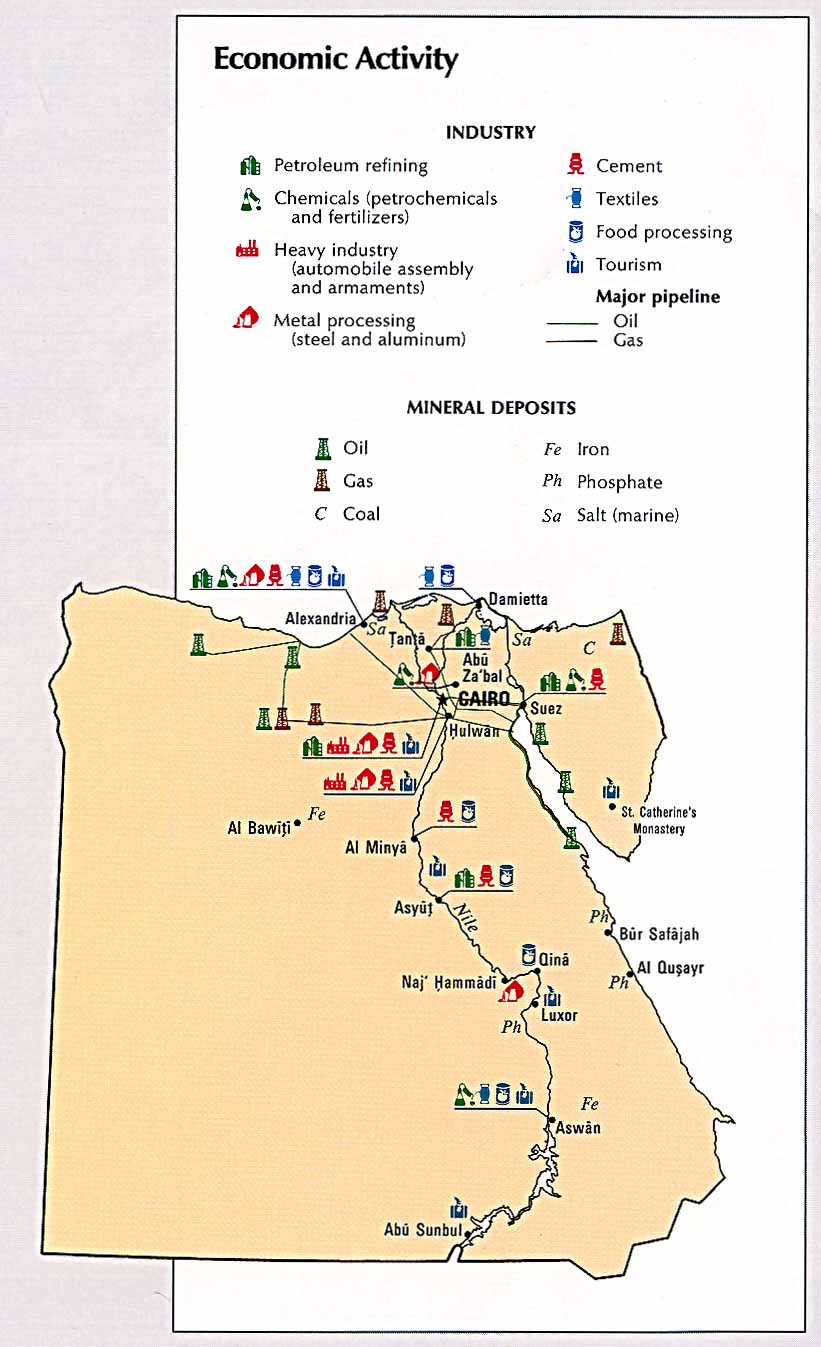
- Egypt - Economic Activity from the CIA Atlas of the Middle East 1993(107K)
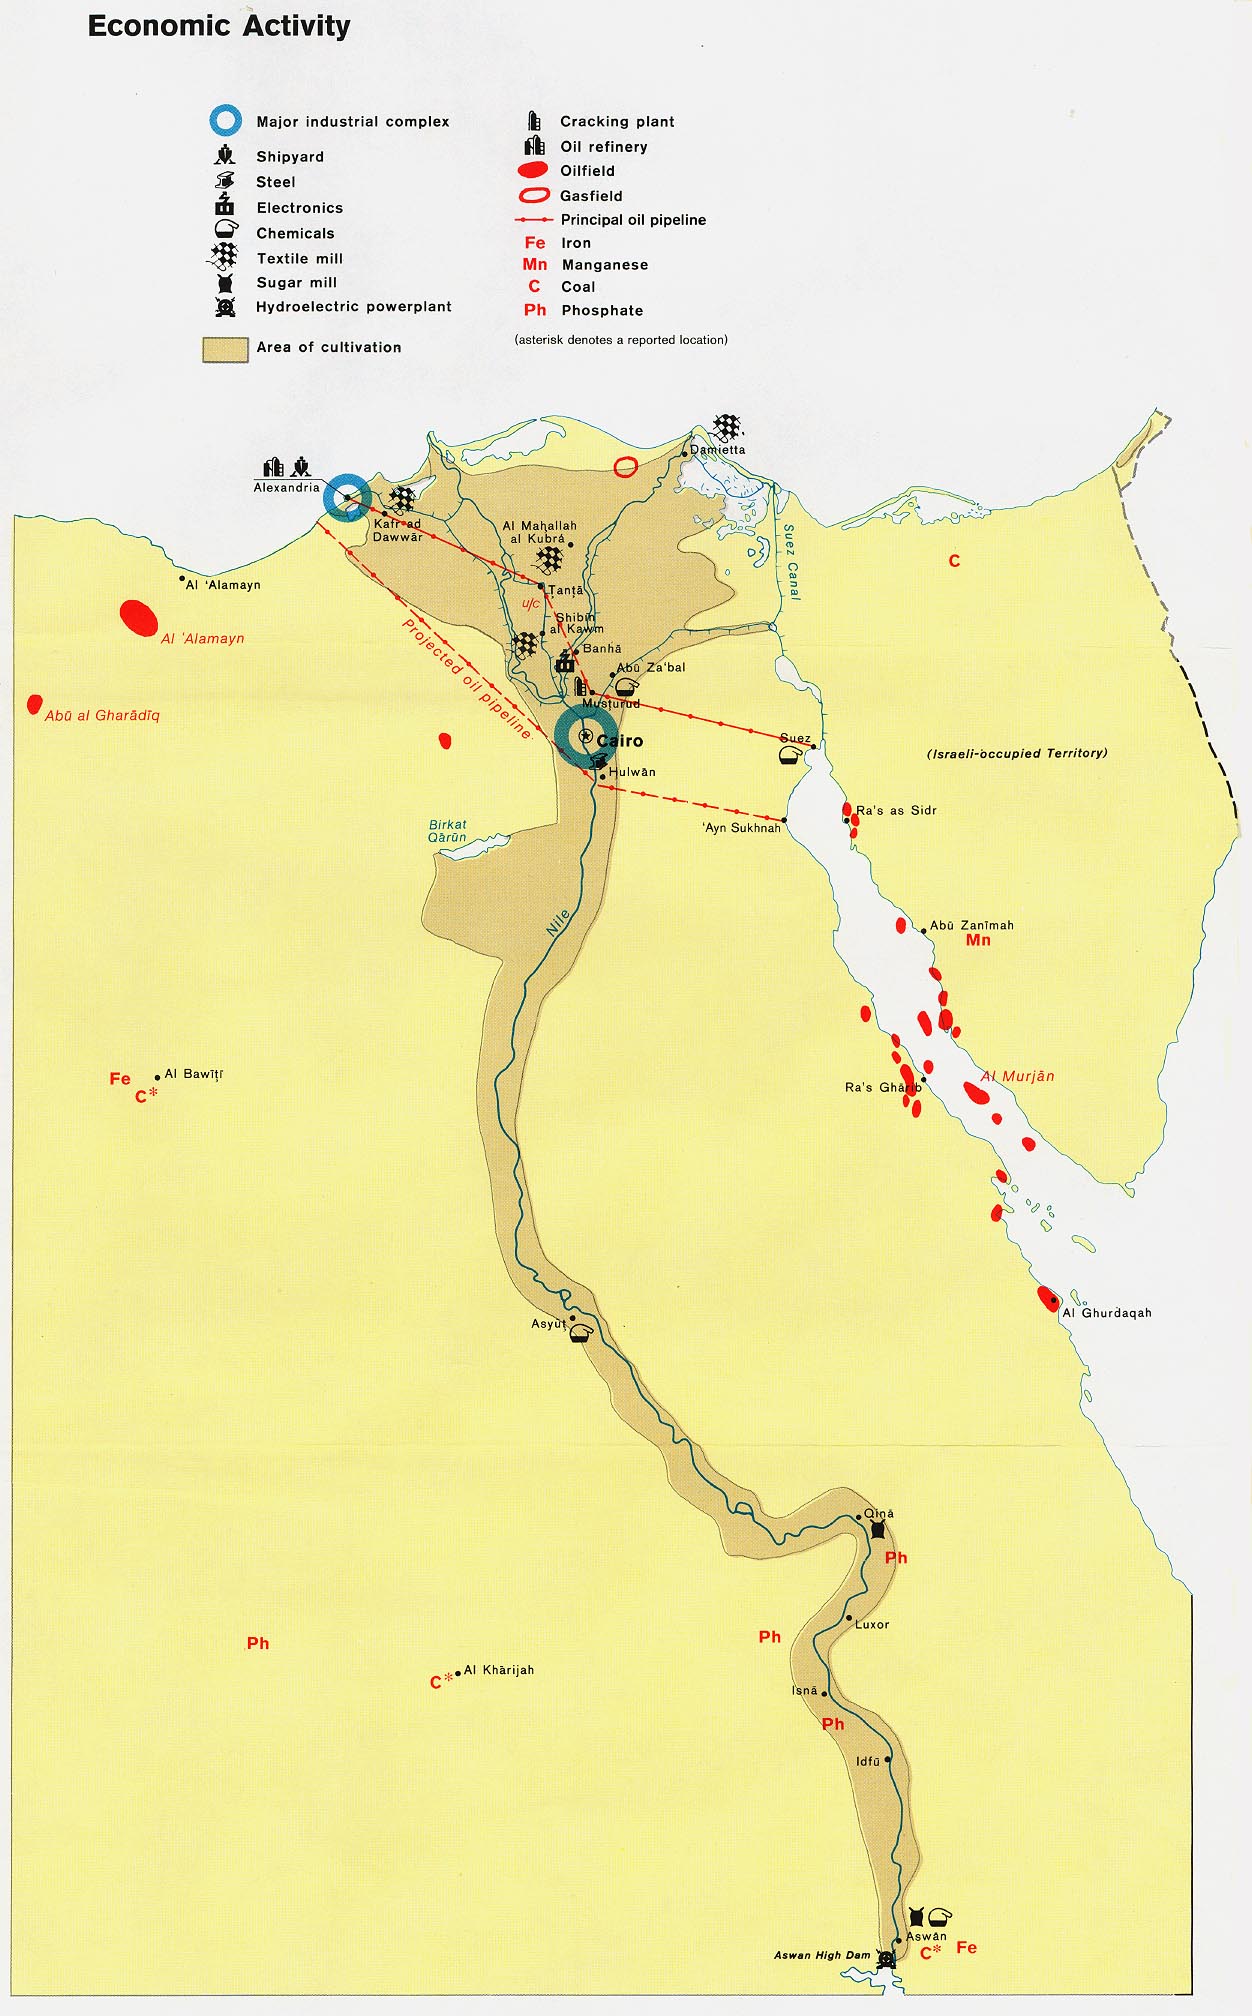
- Egypt - Economic Activity from Map No. 500648 1971 (266K)
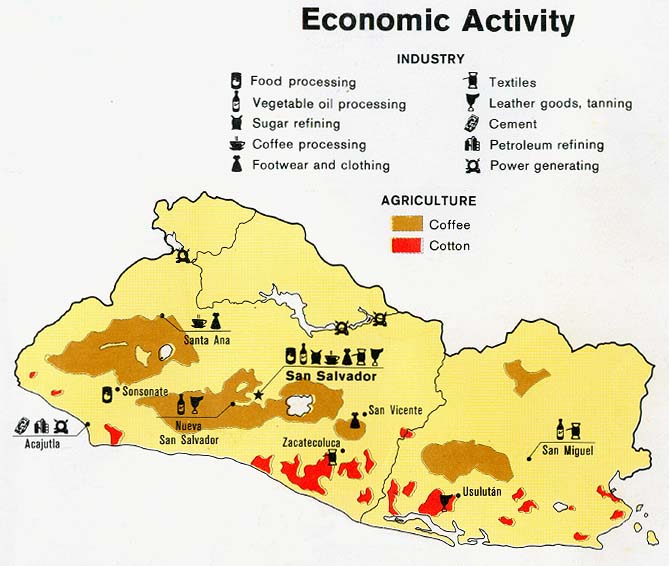
- El Salvador - Economic Activity from Map No. 504473 1980 (87K)
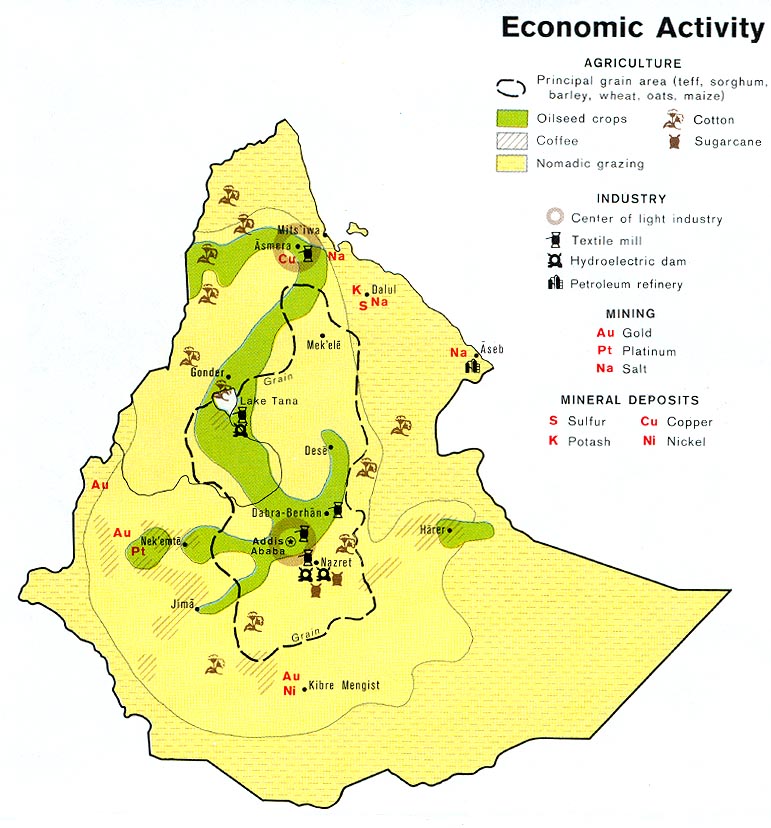
- Ethiopia - Economic Activity from Map No. 503188 1976 (138K)
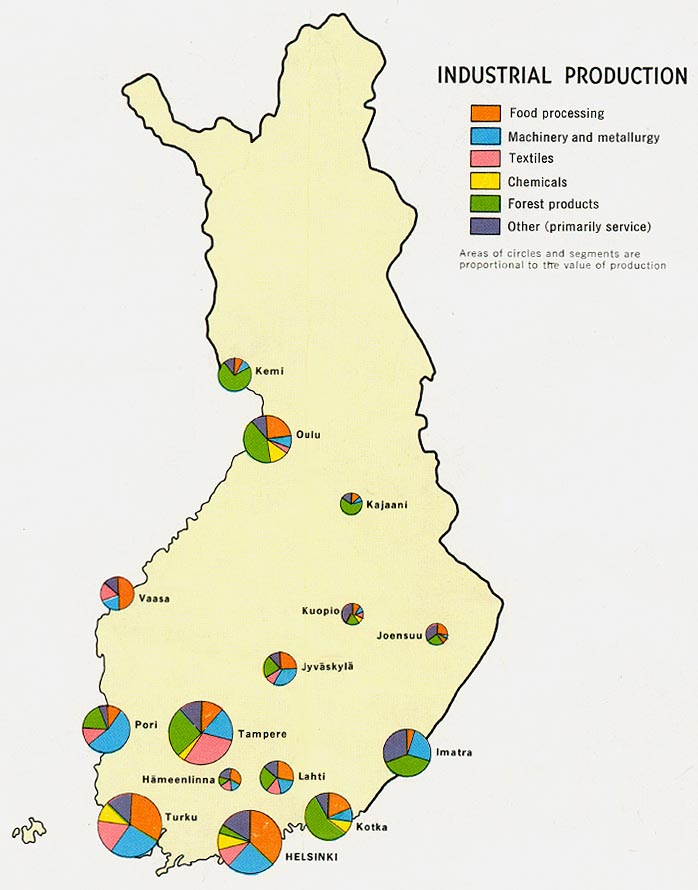
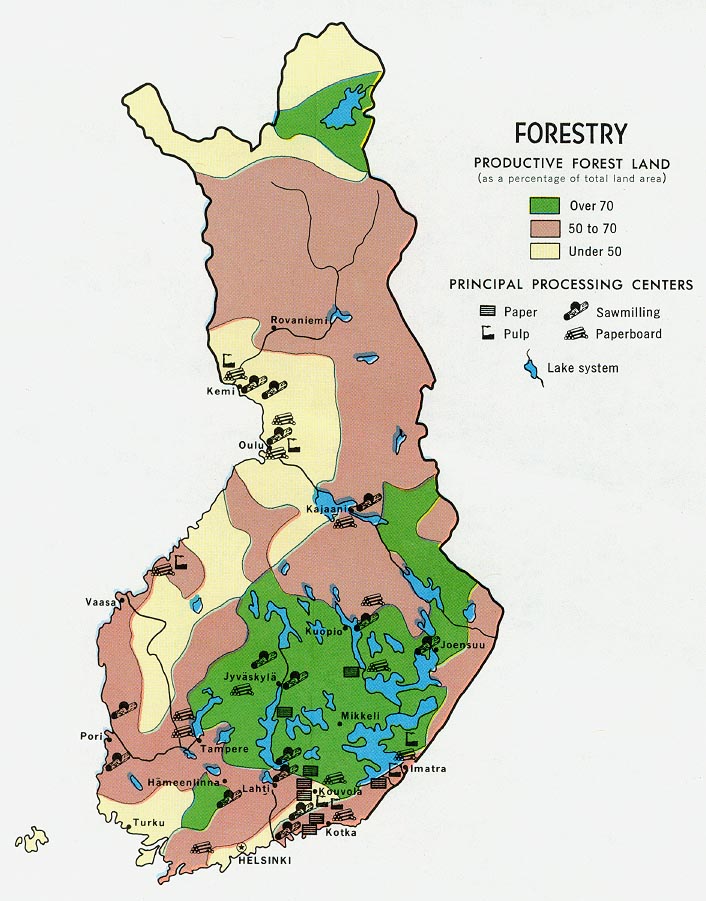
- Finland - Industry from Map No. 58419 1969 (89K)
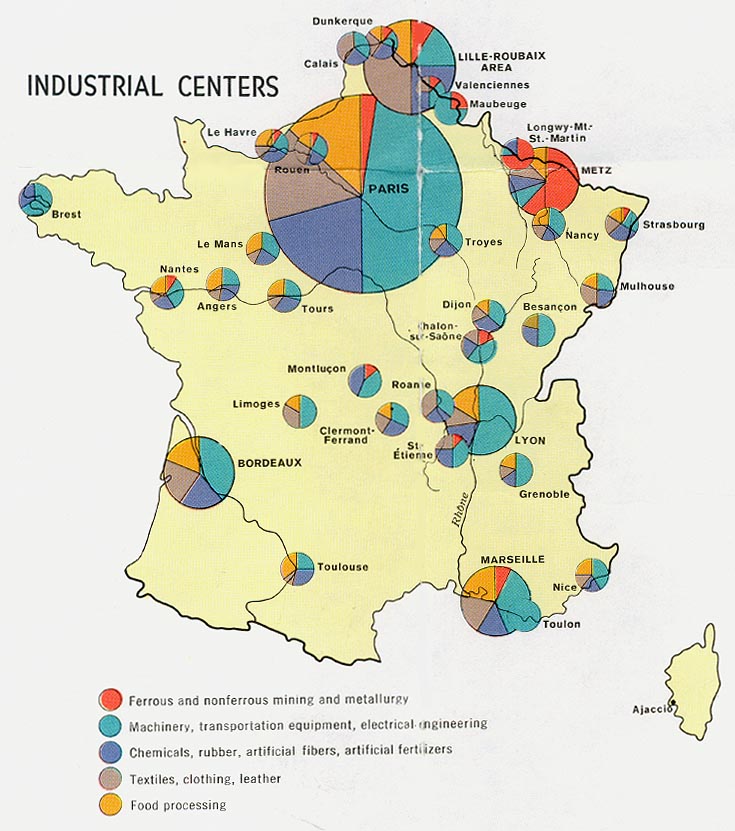
- France - Industrial Centers from Map No. 500197 1972 (132K)
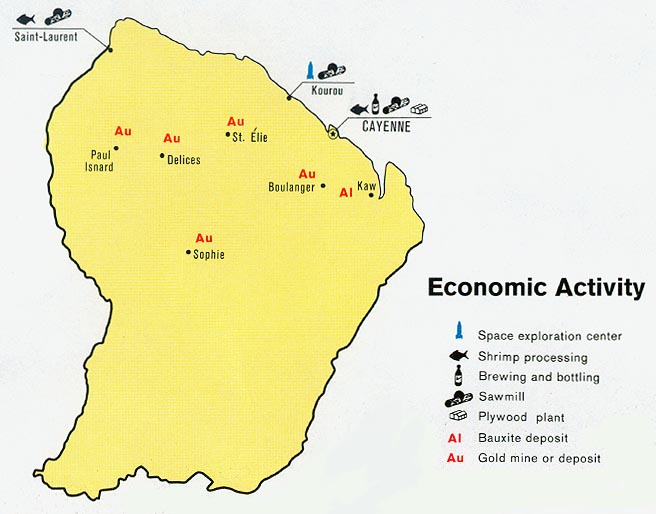
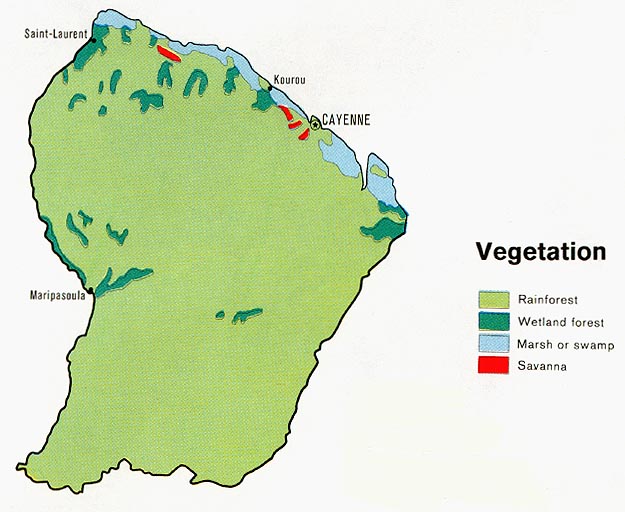
- French Guiana - Economic Activity from Map No. 500460 1972 (70K)
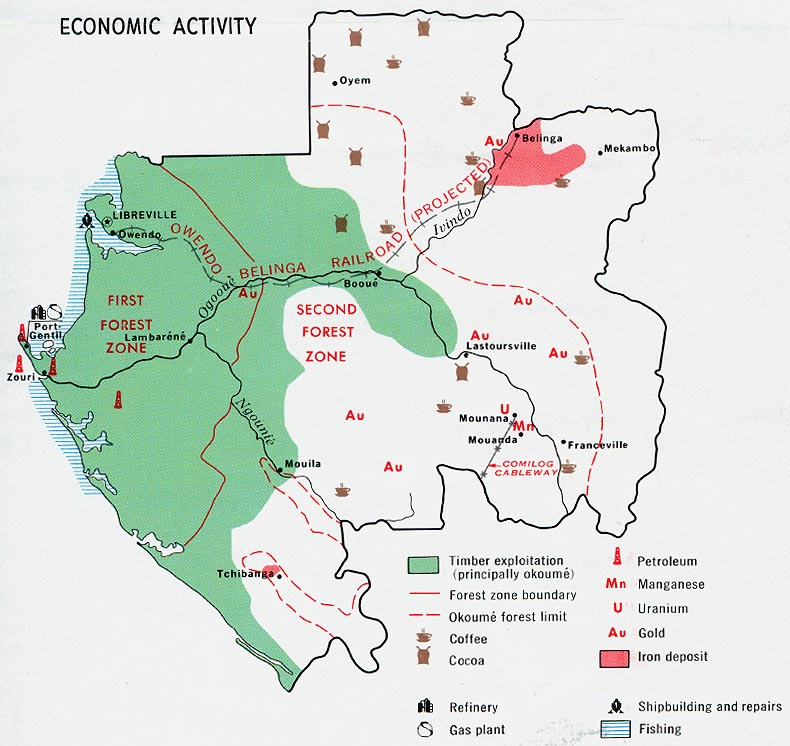
- Gabon - Economic Activity from Map No. 56867 1968 (136K)
- Germany, Eastern - Economic Activity from the CIA Atlas of Eastern Europe 1990 (133K)
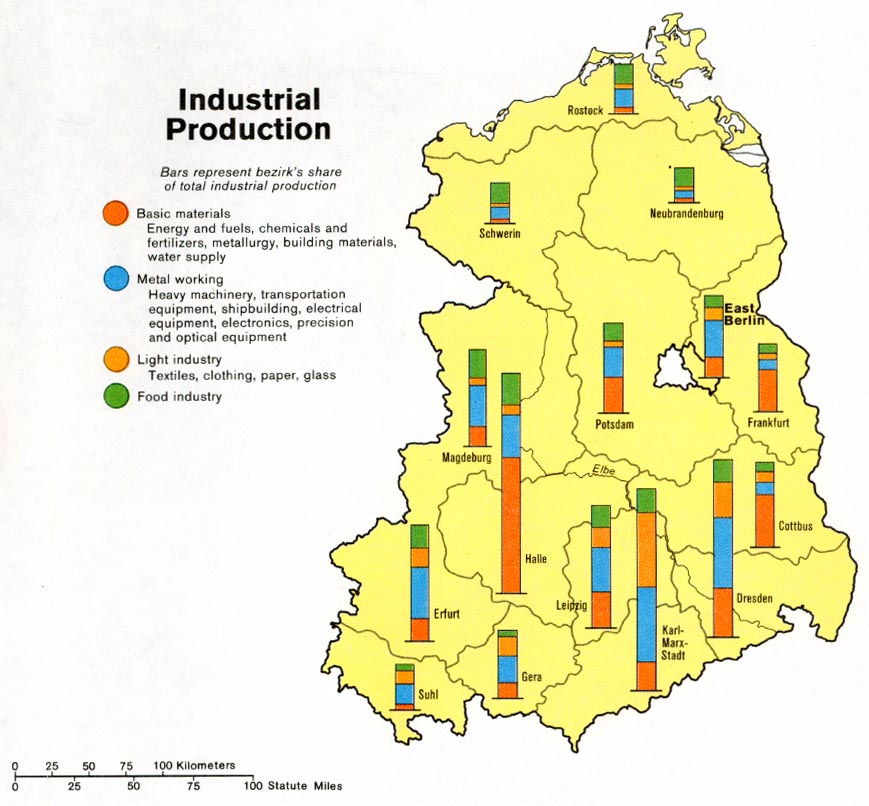
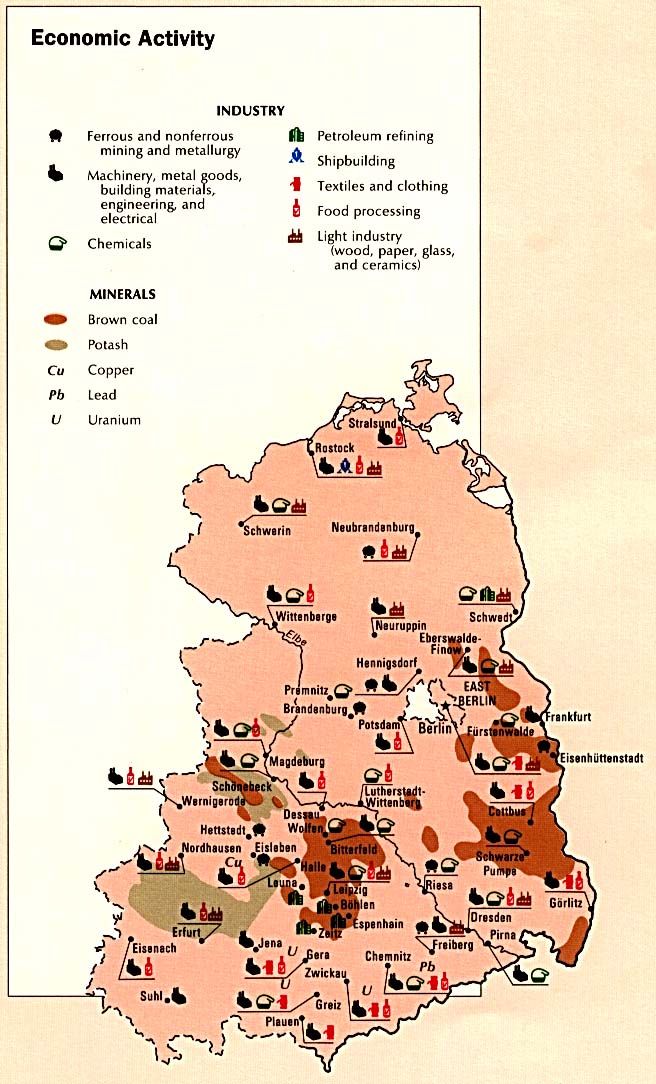
- Germany, Eastern - Industrial Production from Map No. 504708 1981 (131K)
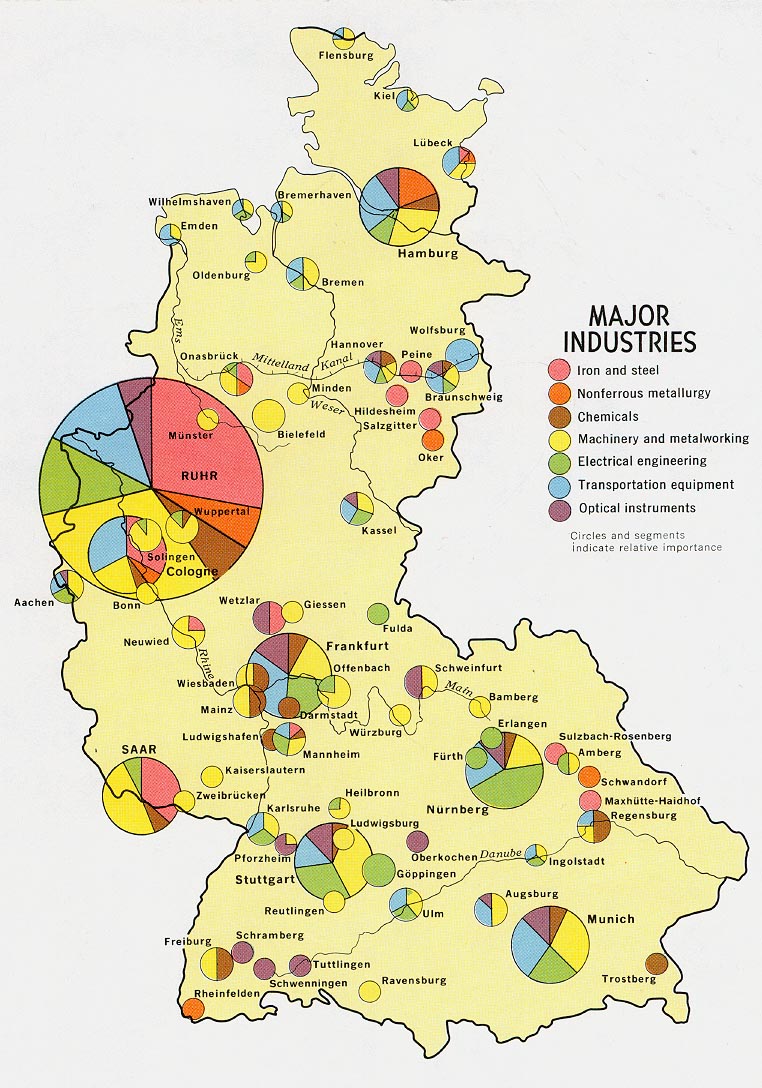
- Germany, Western - Major Industry from Map No. 500470 1972 (212K)
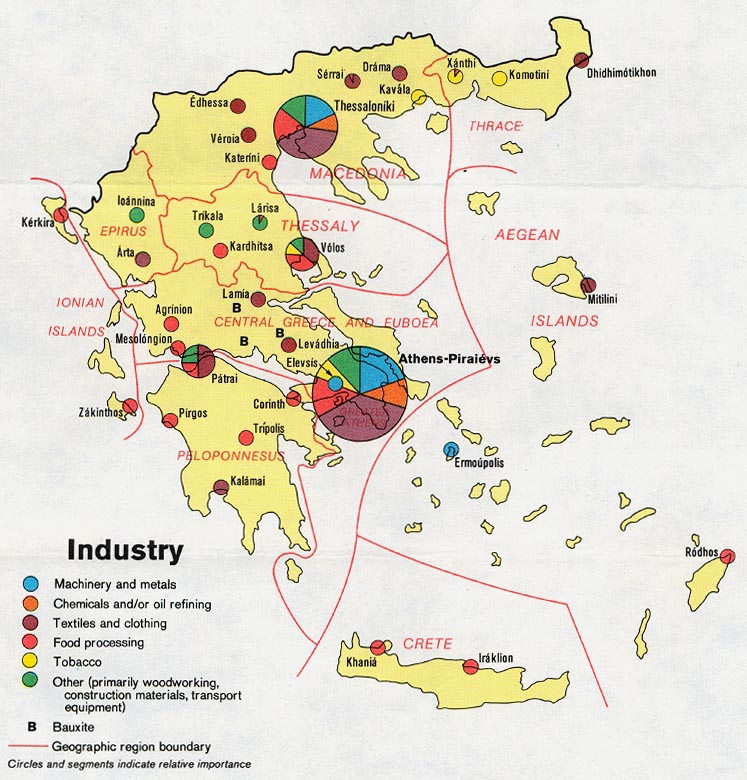
- Greece - Industry from Map No. 501684 1973 (163K)
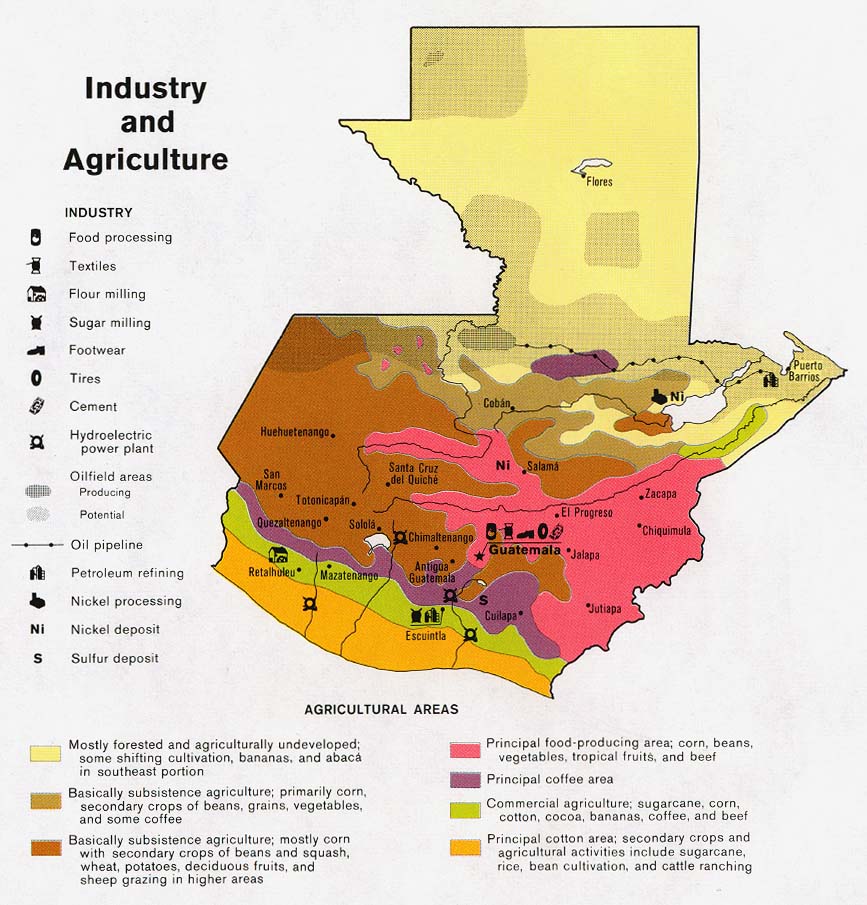
- Guatemala - Industry and Agriculture from Map No. 504829 1983 (161K)
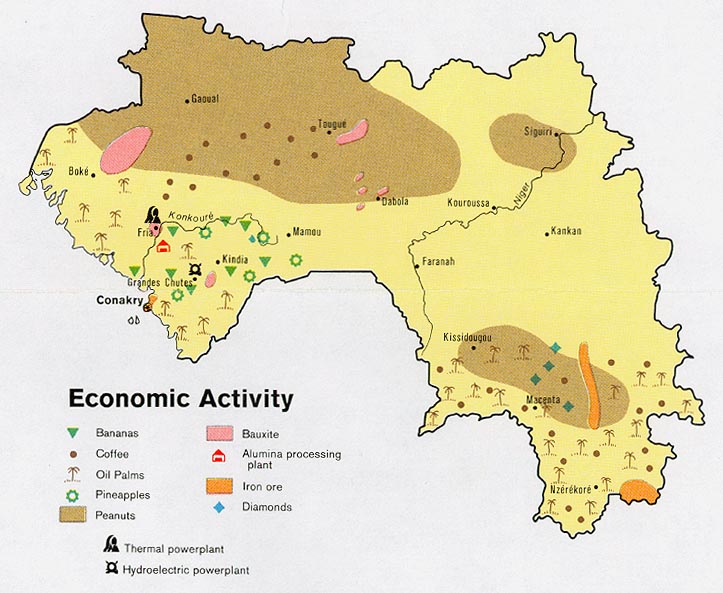
- Guinea - Economic Activity from Map No. 501172 1973 (107K)
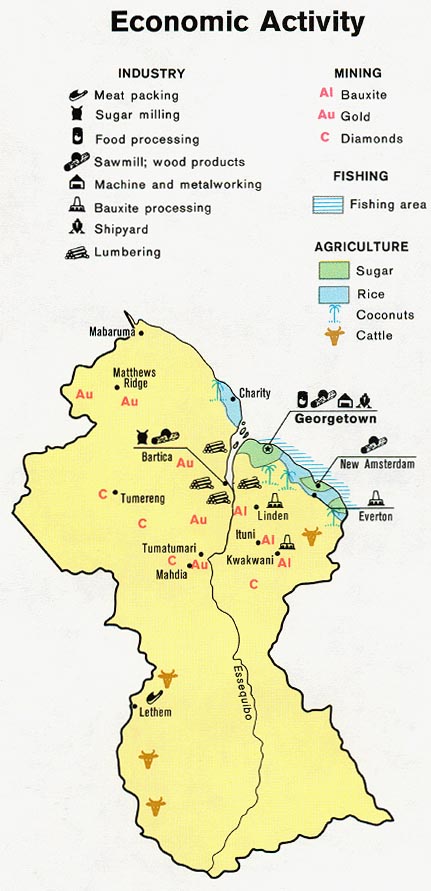
- Guyana - Economic Activity from Map No. 500987 1973 (86K)
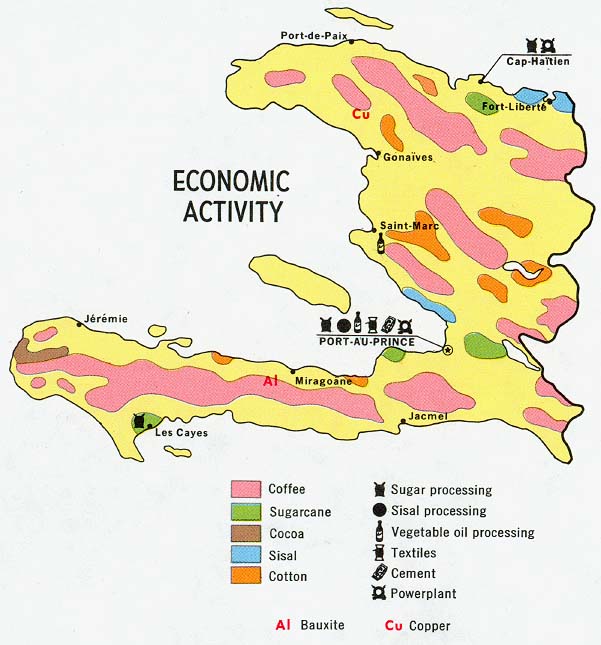
- Haiti - Economic Activity from Map No. 77972 1970 (90K)
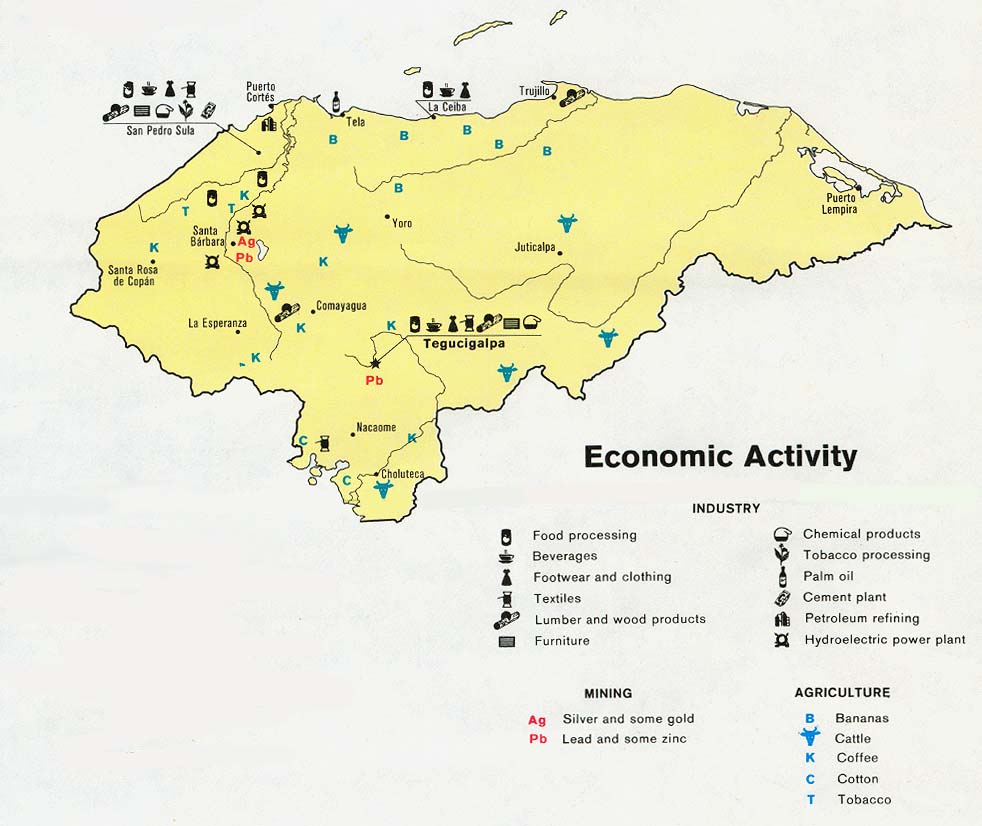
- Honduras - Economic Activity from Map No. 504929 1983 (110K)
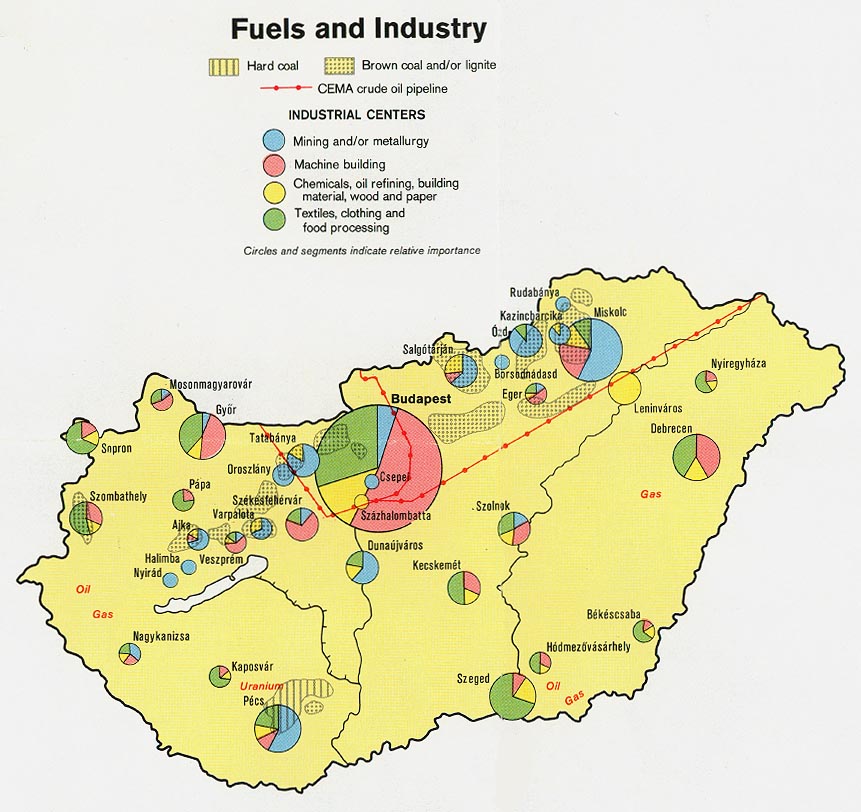
- Hungary - Industry from Map No. 501074 1973 (147K)
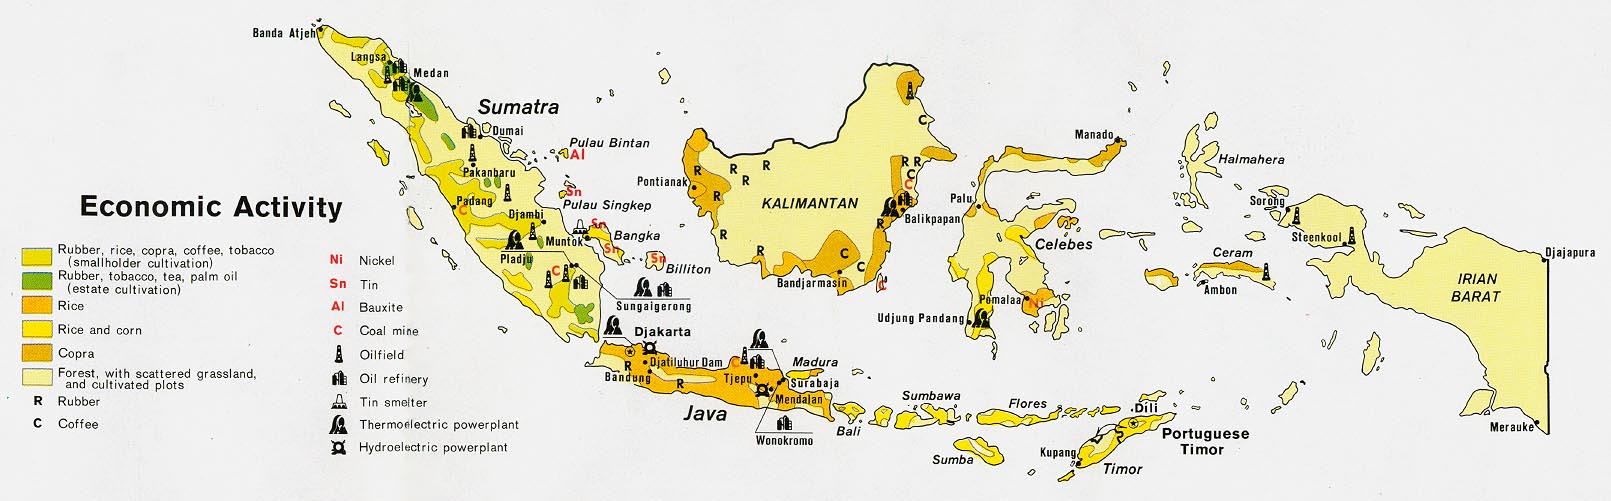
- Indonesia - Economic Activity from Map No. 500869 1972 (149K)
- Iran - Economic Activity from the CIA Atlas of the Middle East 1993 (118K)
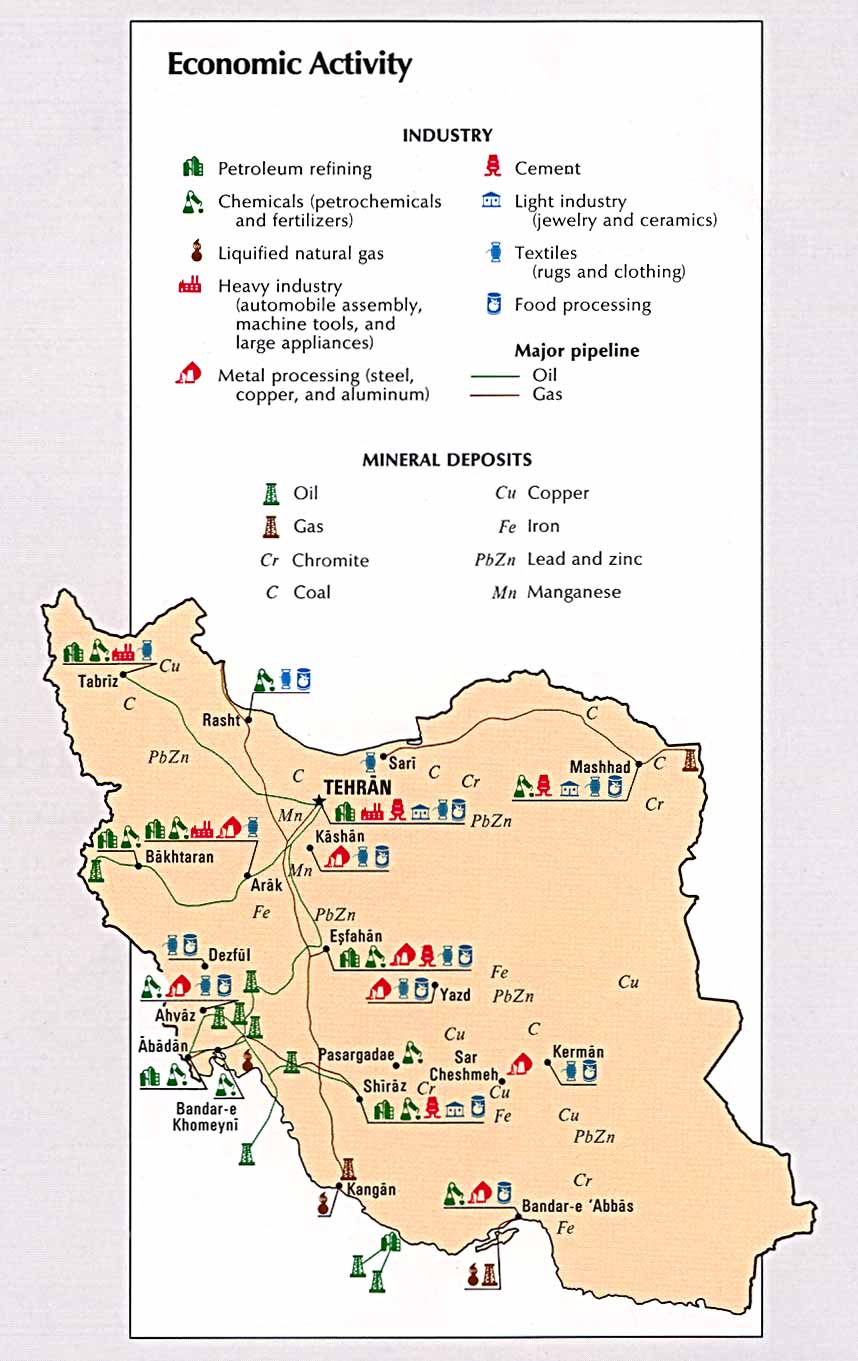
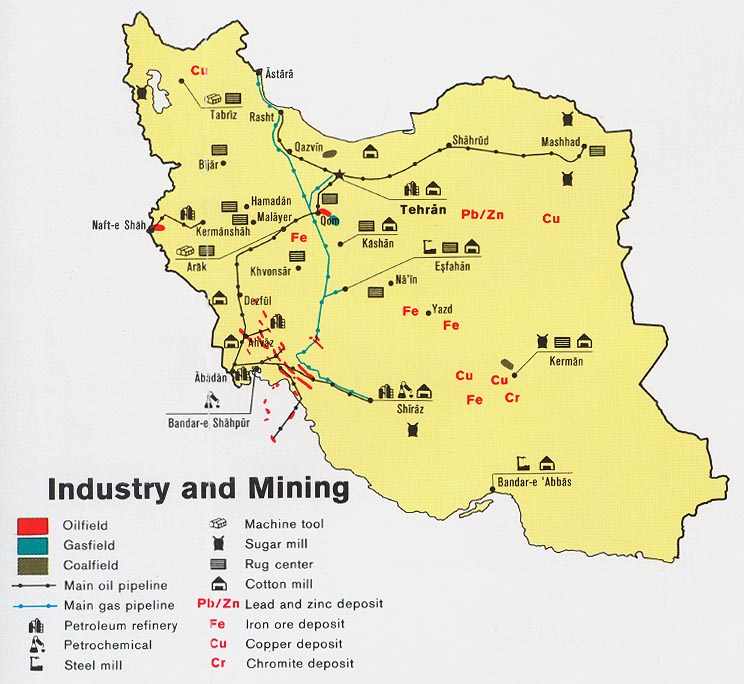
- Iran - Industry and Mining from Map No. 503828 1978 (109K)
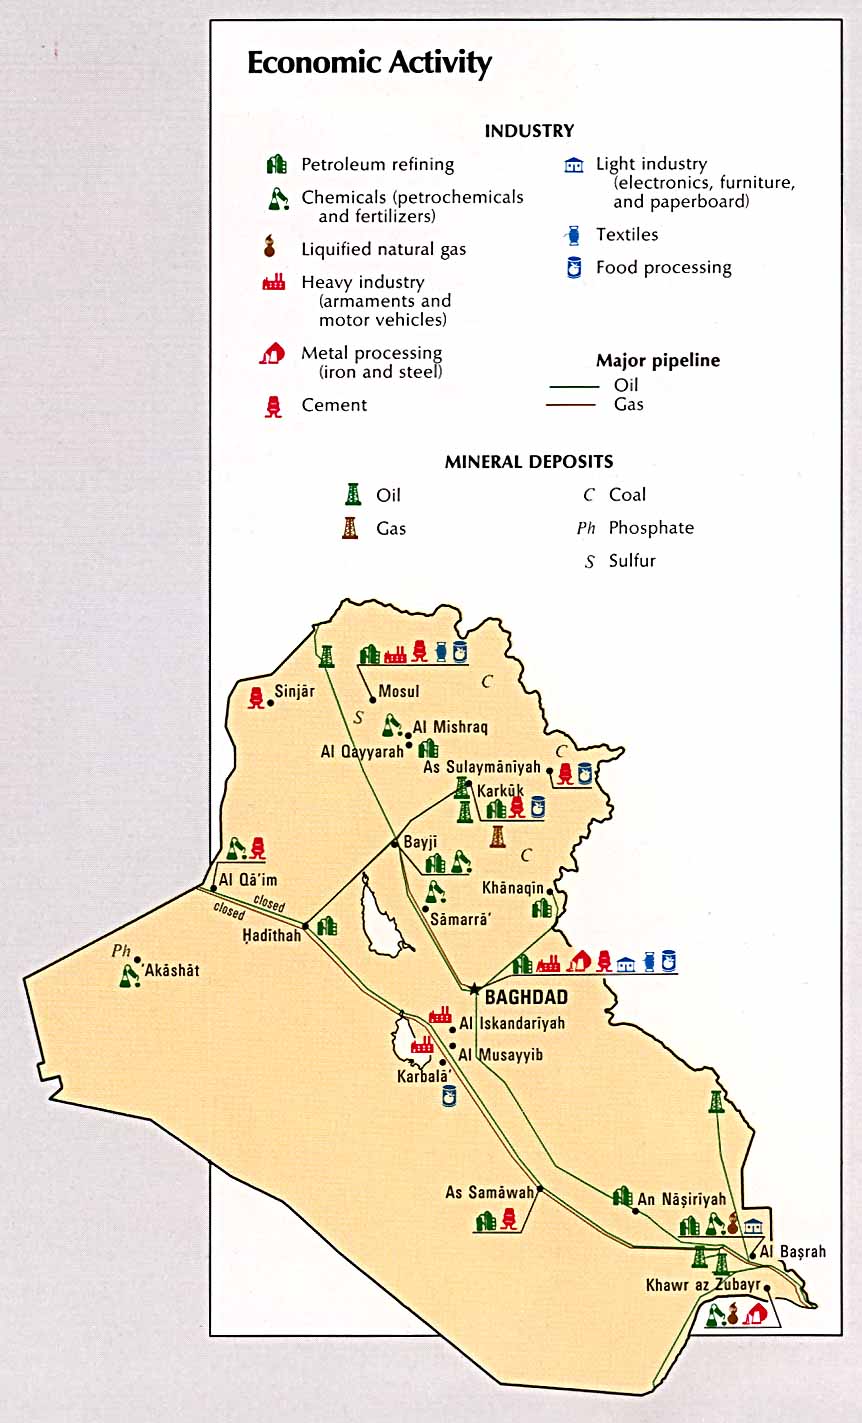
- Iraq - Economic Activity from the CIA Atlas of the Middle East 1993 (115K)
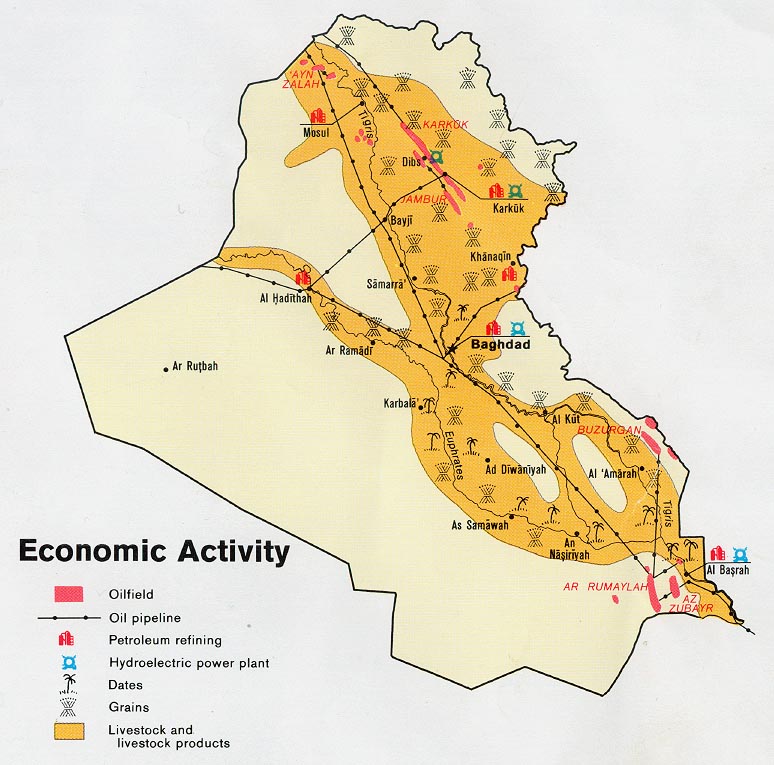
- Iraq - Economic Activity from Map No. 503930 1978 (134K)
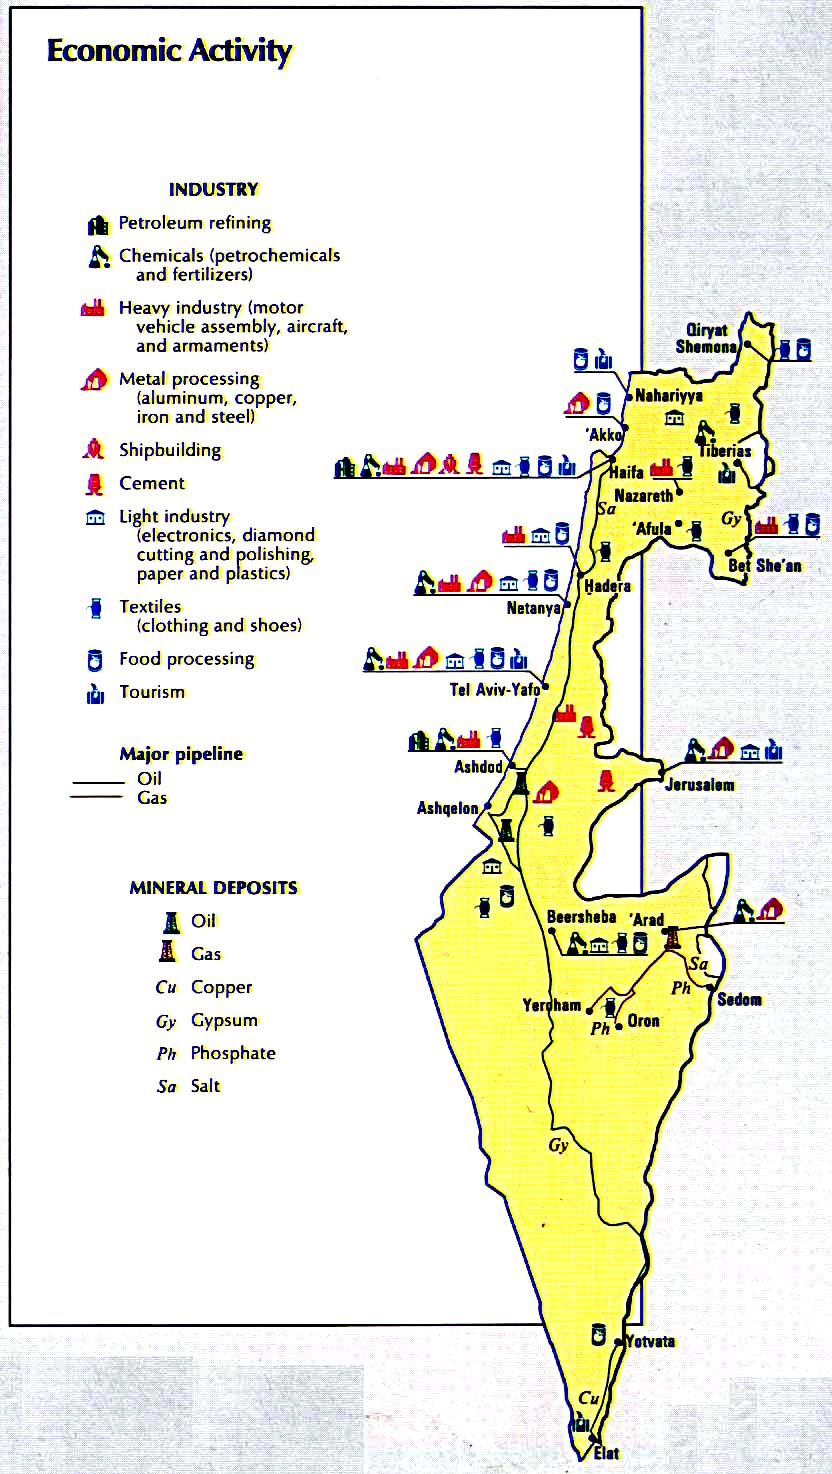
- Israel - Economic Activity from the CIA Atlas of the Middle East 1993 (196K)
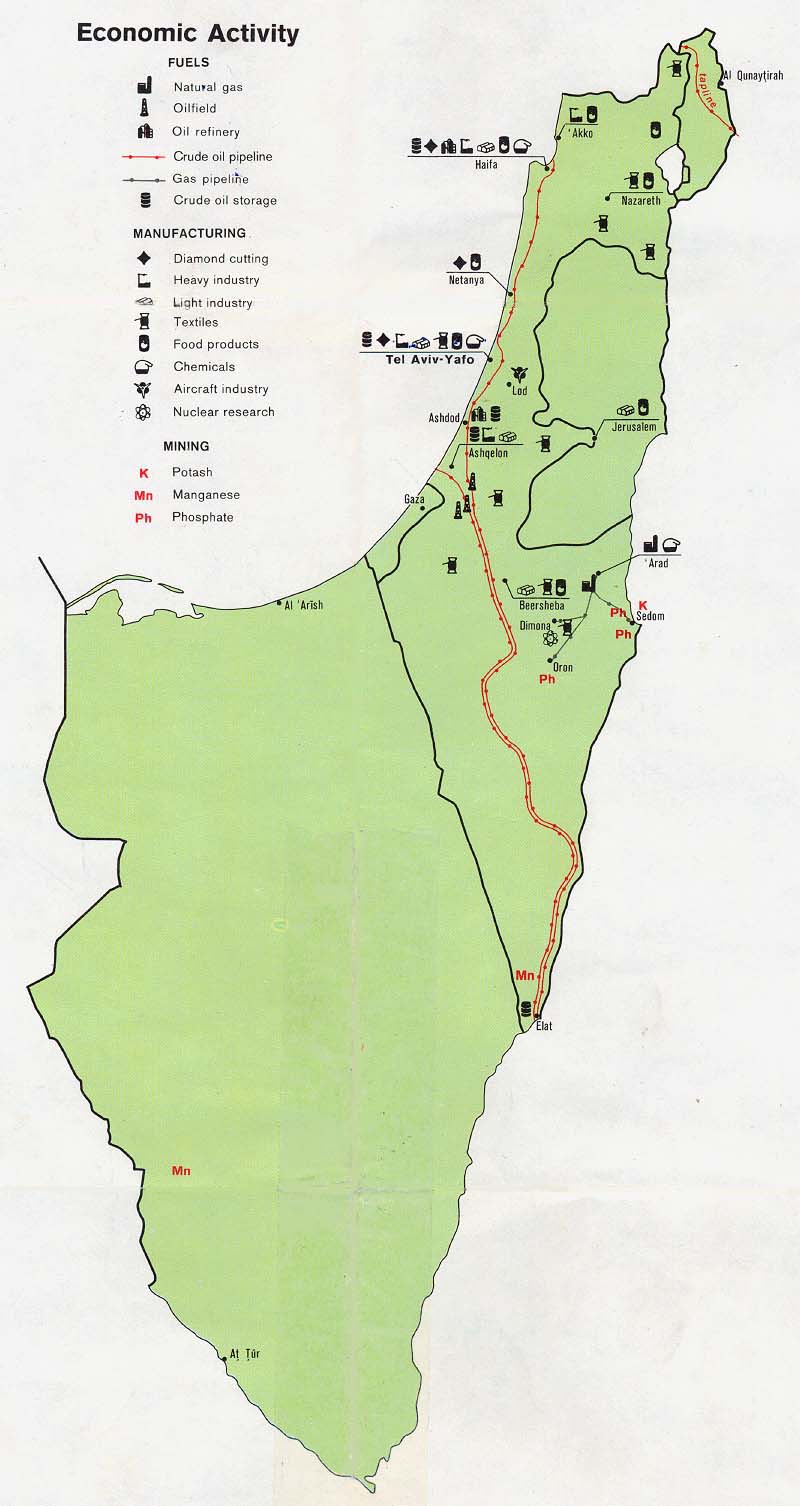
- Israel - Economic Activity from Map No. 53499 1978 (113K)
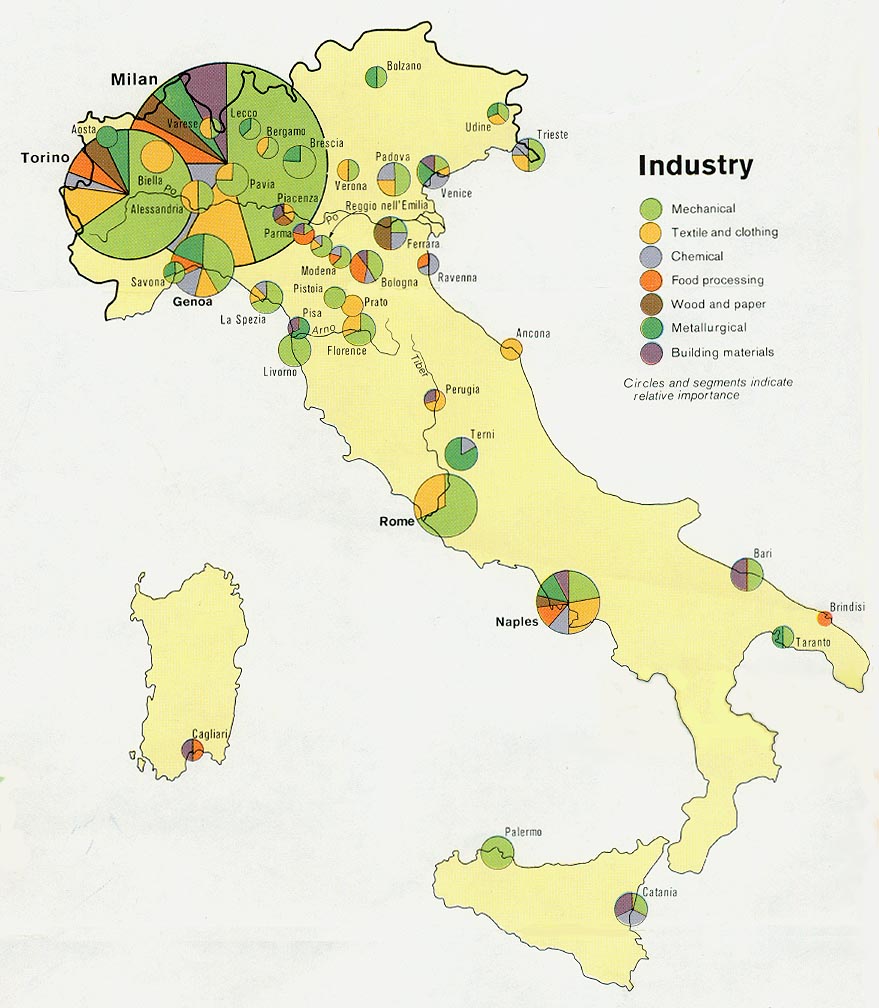
- Italy - Industry from Map No. 501445 1972 (145K)
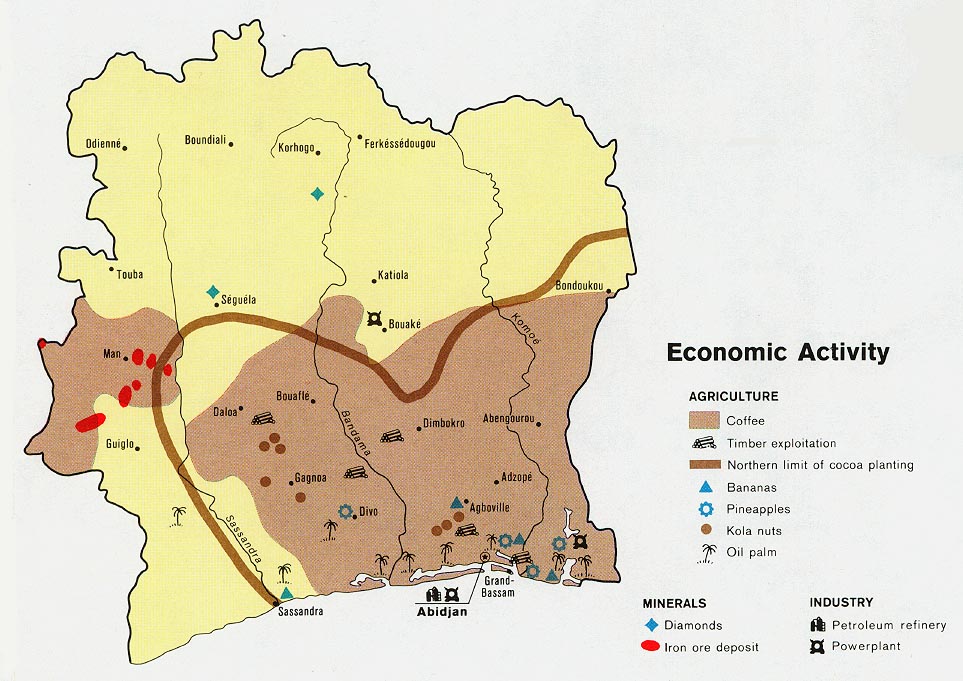
- Ivory Coast - Economic Activity from Map No. 500455 1972 (147K)
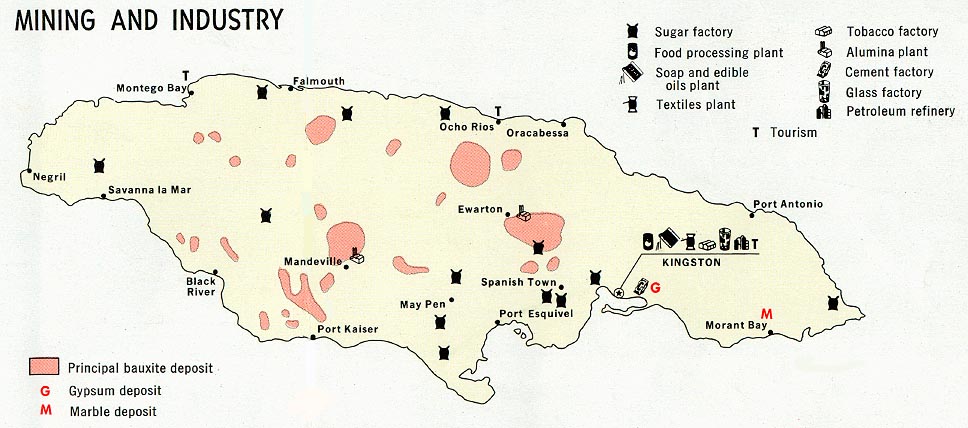
- Jamaica - Mining and Industry from Map No. 58780 1968 (104K)
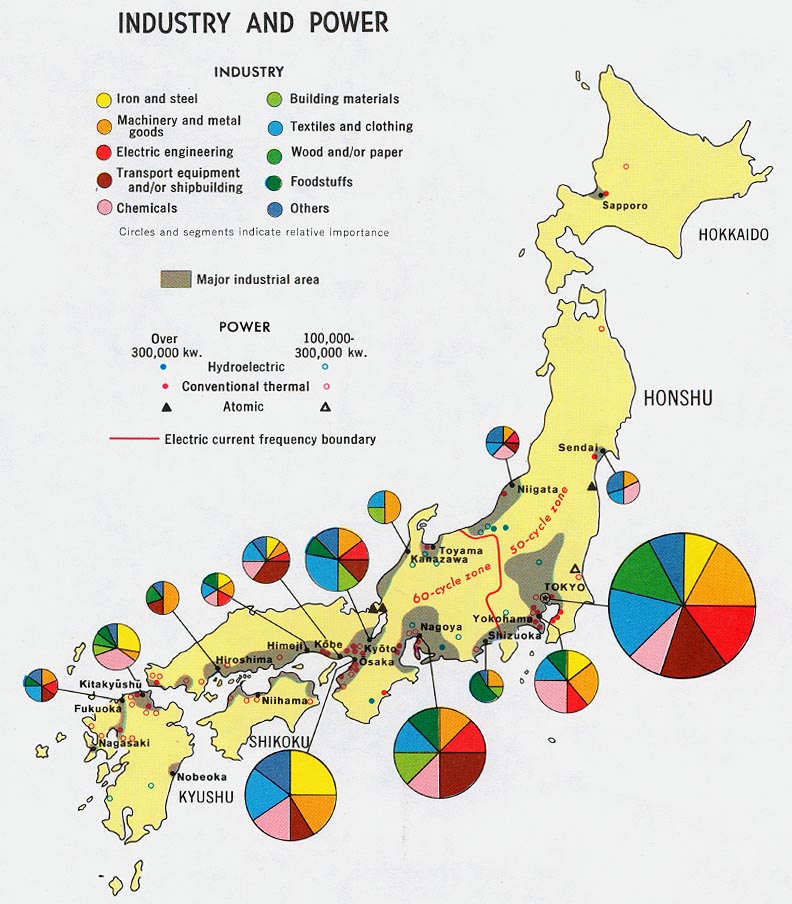
- Japan - Industry and Power from Map No. 78643 1971 (150K)
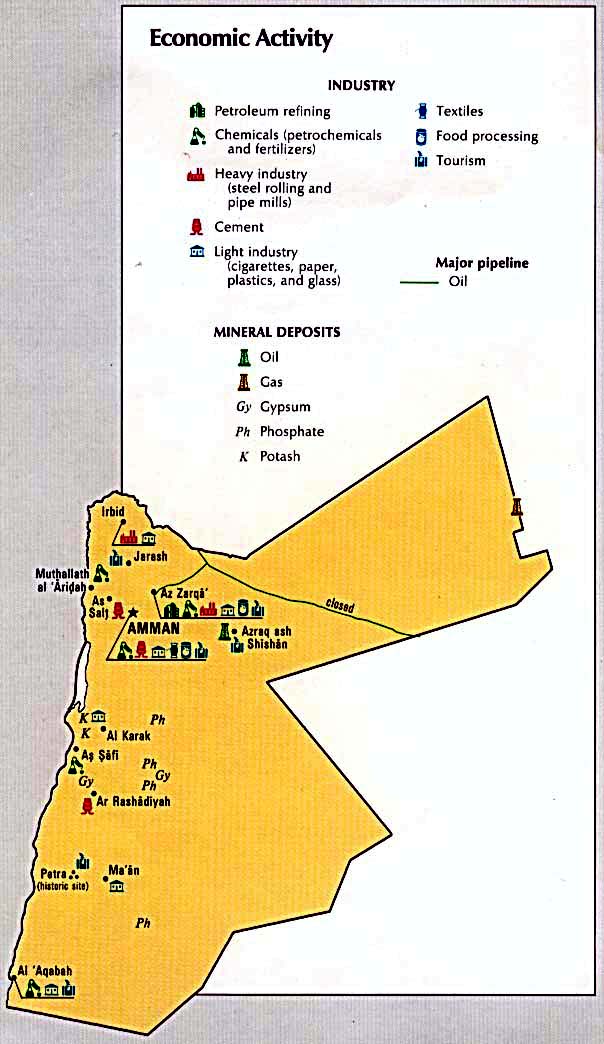
- Jordan - Economic Activity from the CIA Atlas of the Middle East 1993 (89K)
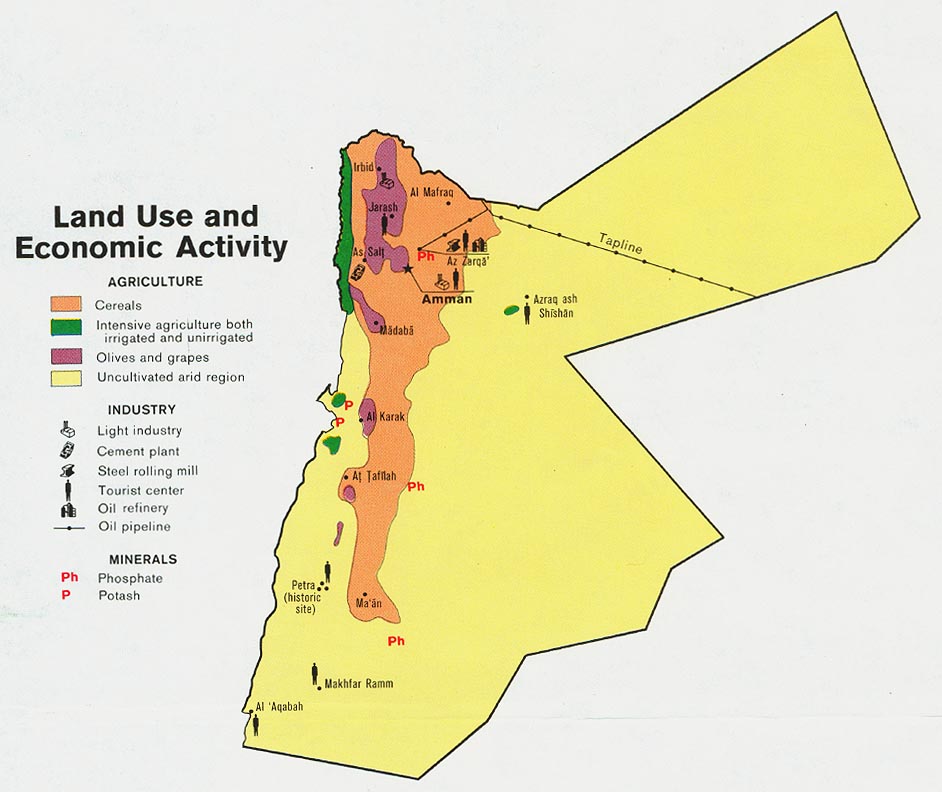
- Jordan - Land Use and Economic Activity from Map No. 505911 1978 (134K)
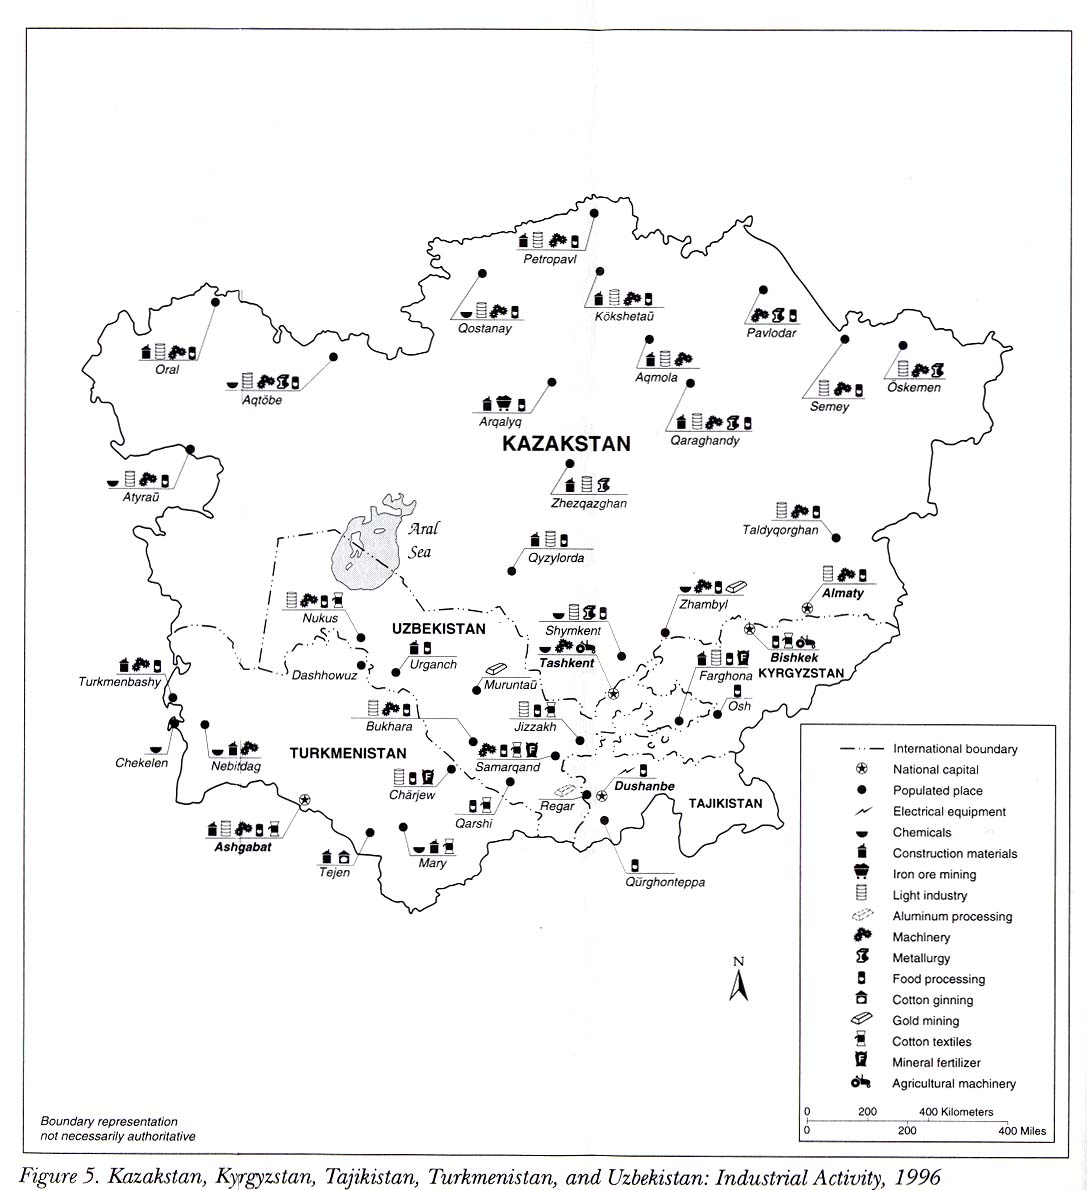
- Kazakstan, Kyrgyzstan, Tajikistan, Turkmenistan, and Uzbekistan: Industrial Activity 1996 from Kazakstan, Kyrgyzstan, Tajikistan, Turkmenistan, and Uzbekistan: Country Studies. 1997 (151K)
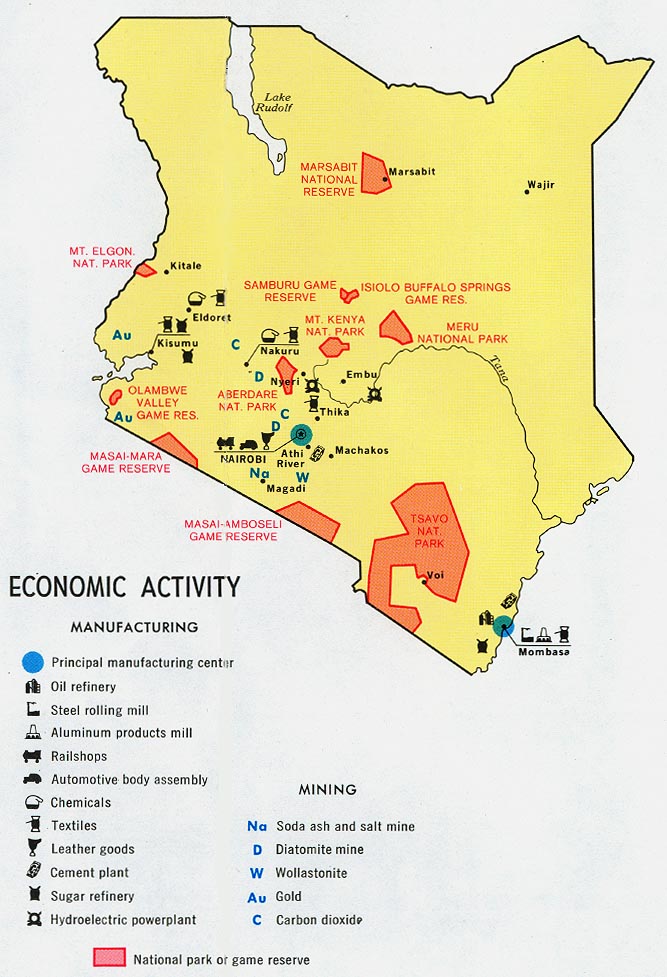
- Kenya - Economic Activity from Map No. 501721 1974 (137K)
- Korea [North] - Economic Activity from Map No. 500773 1972 (140K)
- Korea [South] - Economic Activity from Map No. 501879 1973 (149K)
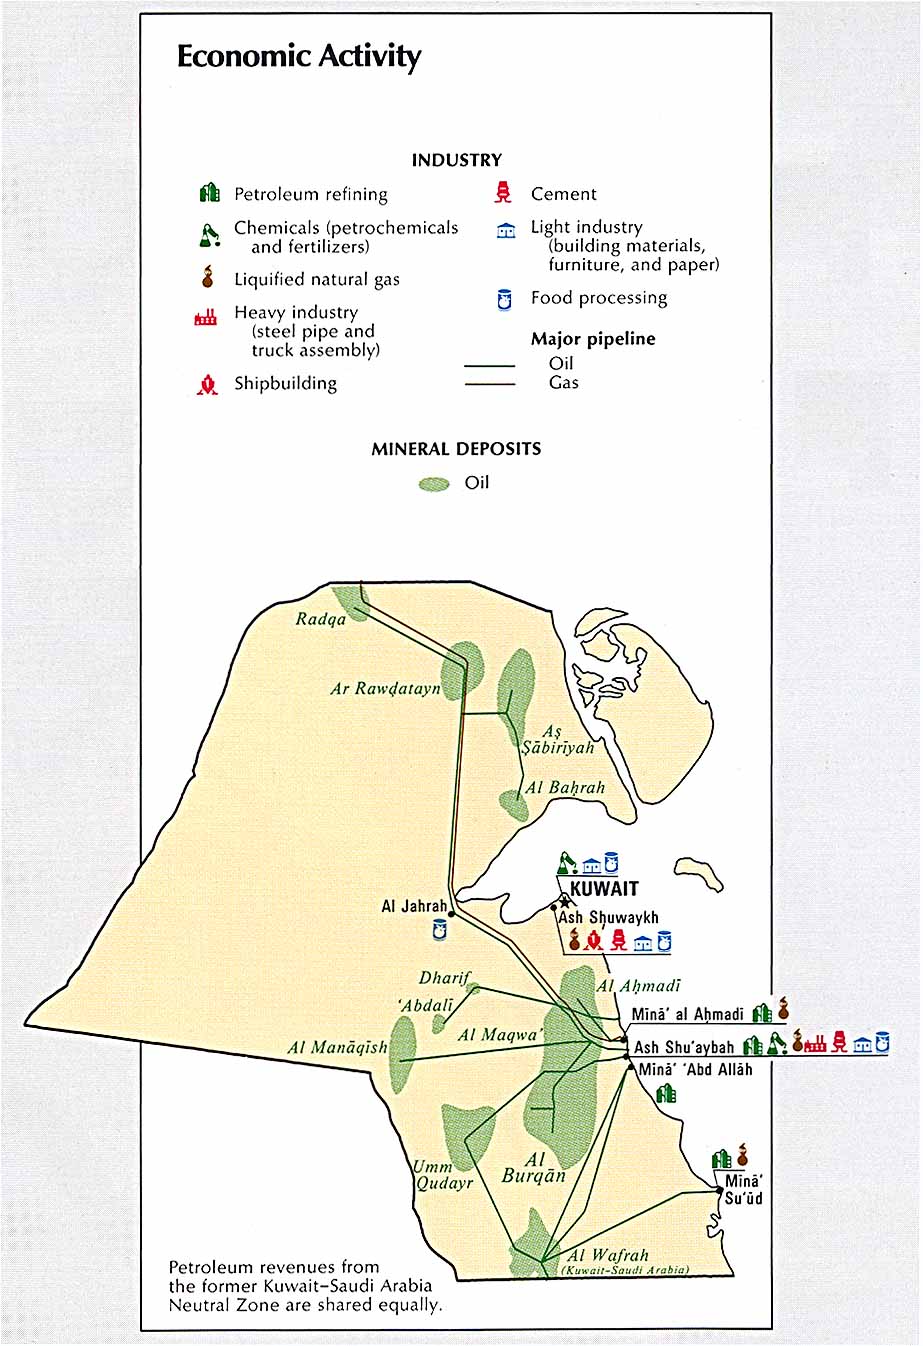
- Kuwait - Economic Activity from the CIA Atlas of the Middle East 1993 (138K)
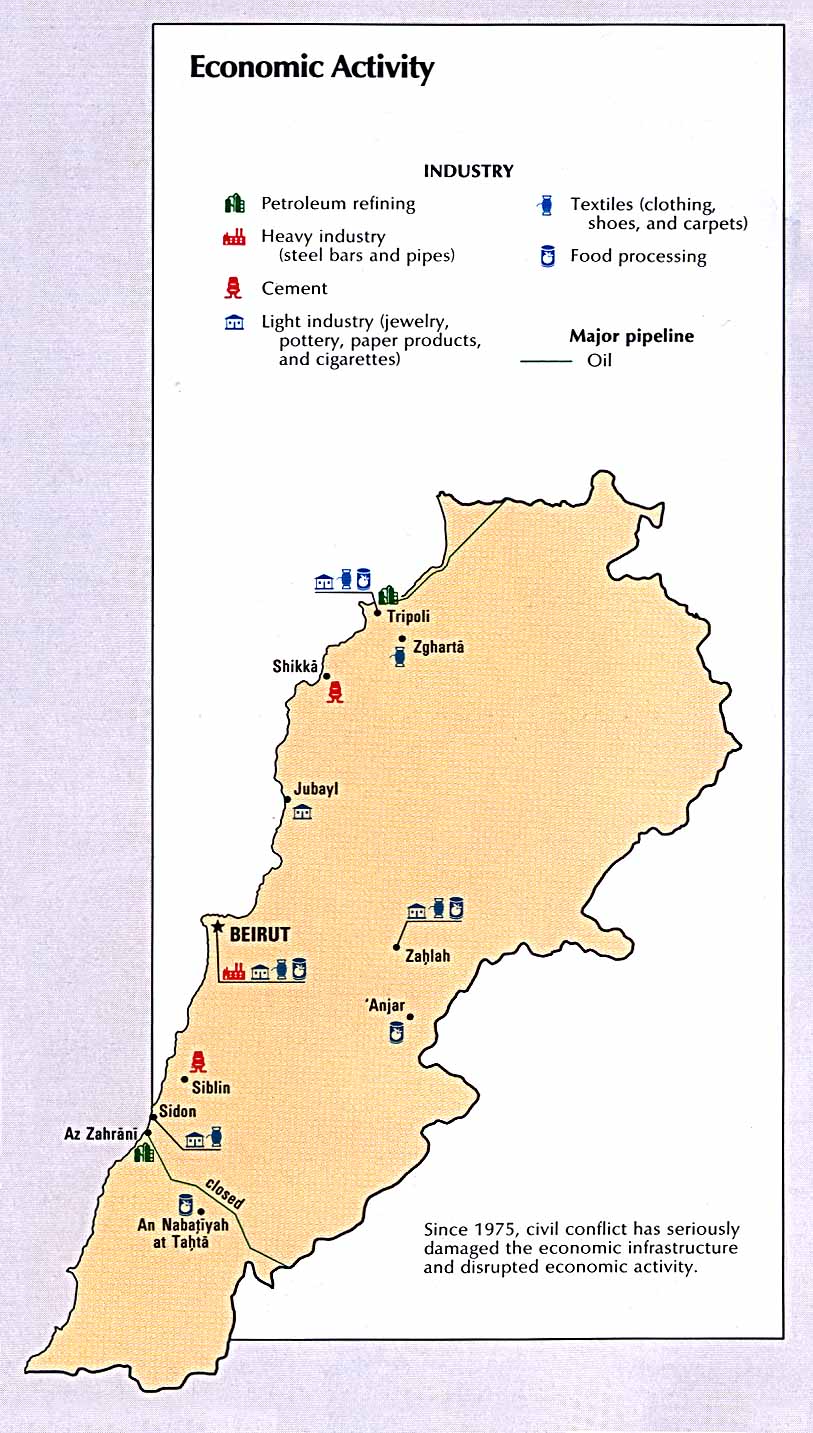
- Lebanon - Economic Activity from the CIA Atlas of the Middle East 1993 (148K)
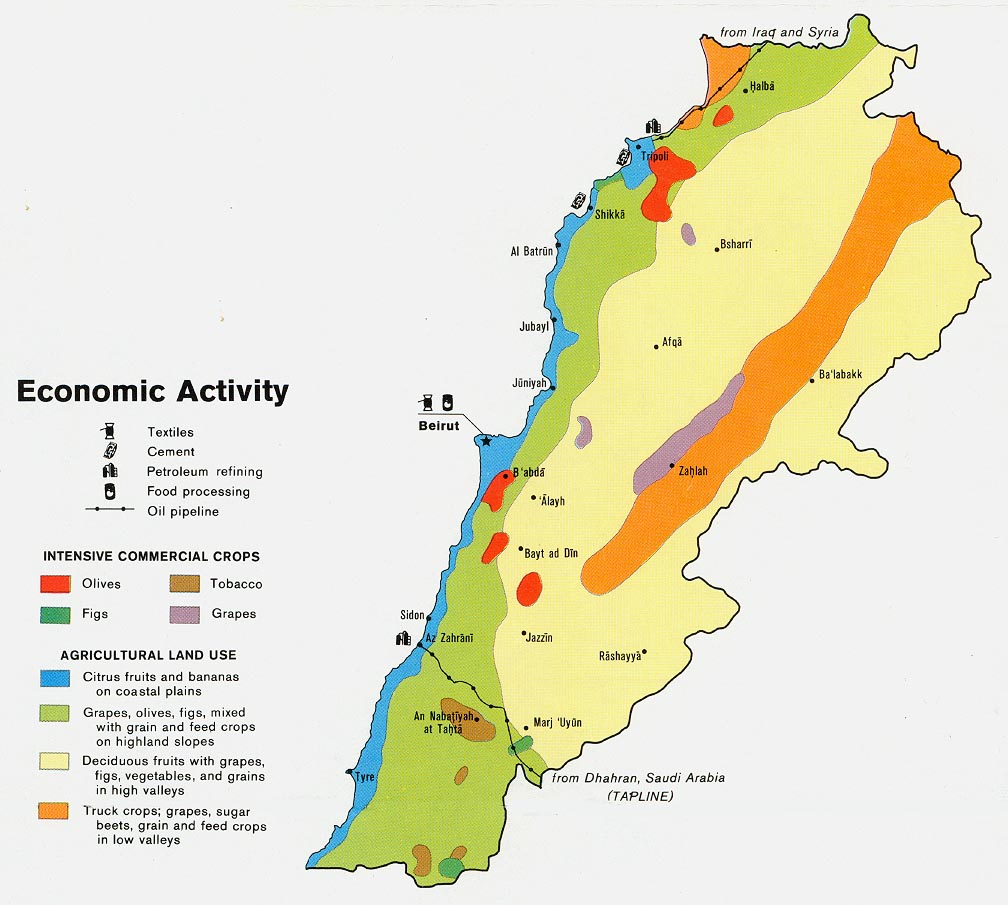
- Lebanon - Economic Activity from Map No. 503804 1968 (104K)
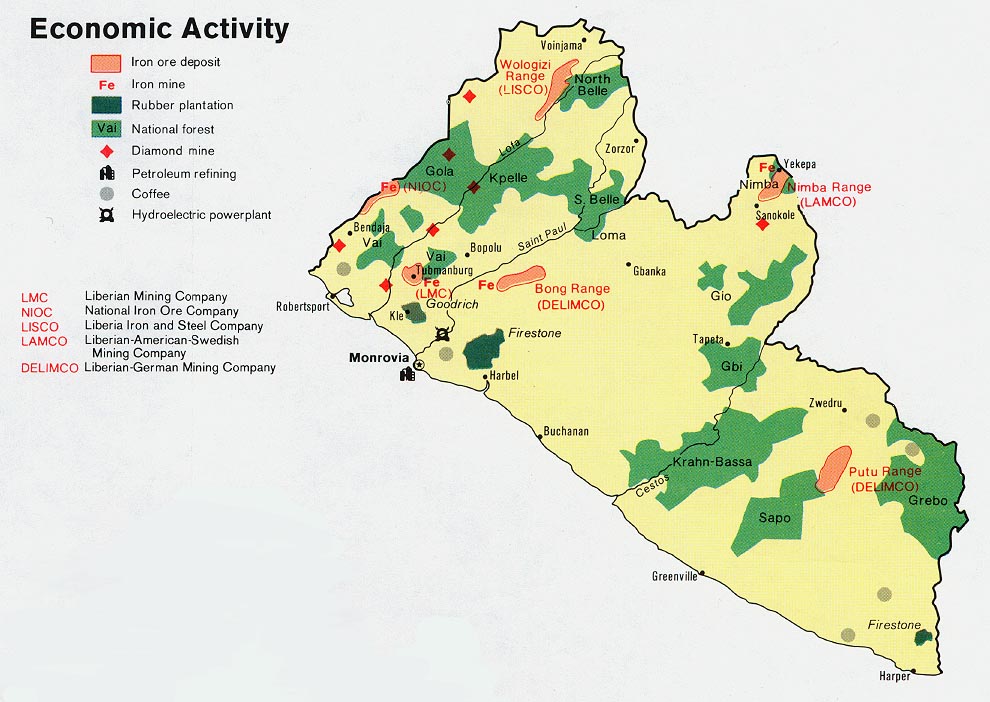
- Liberia - Economic Activity from Map No. 501556 1973 (143K)
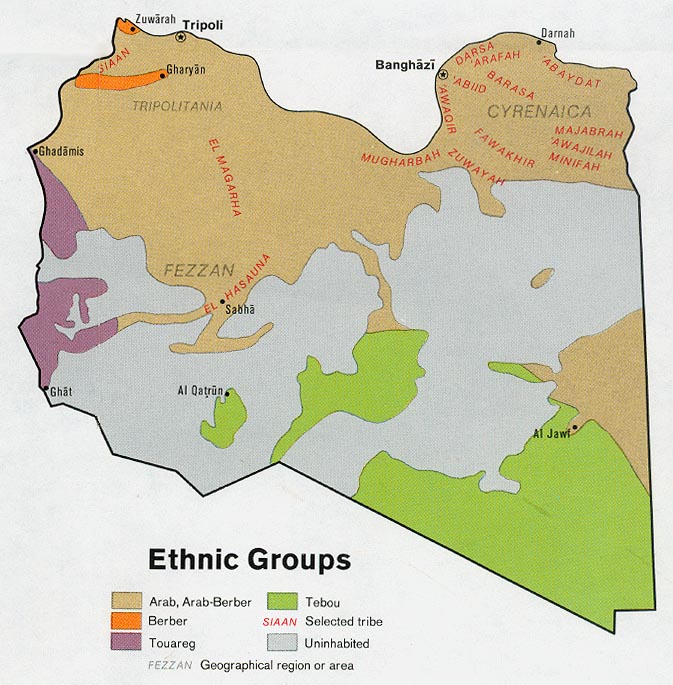
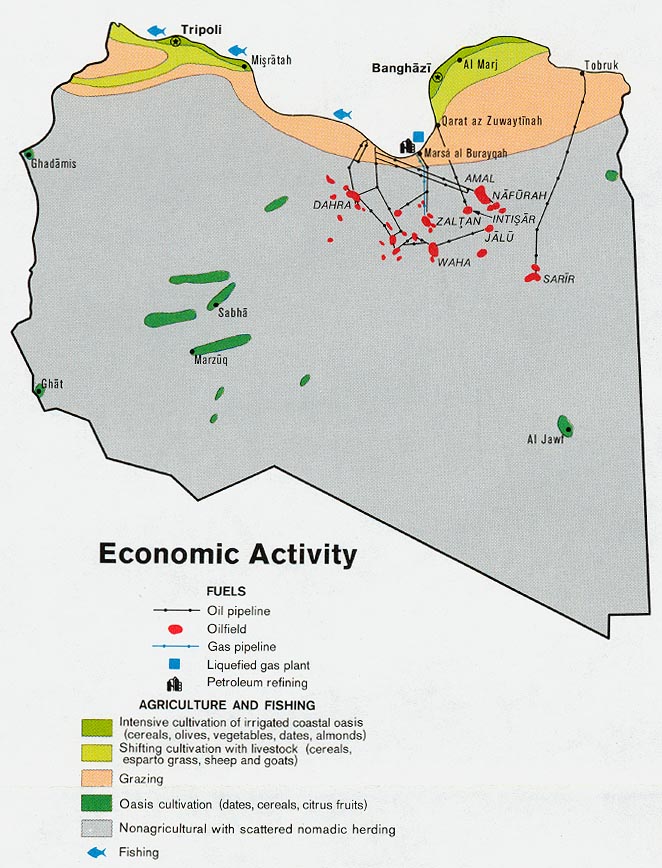
- Libya - Economic Activity from Map No. 501564 1974 (140K)
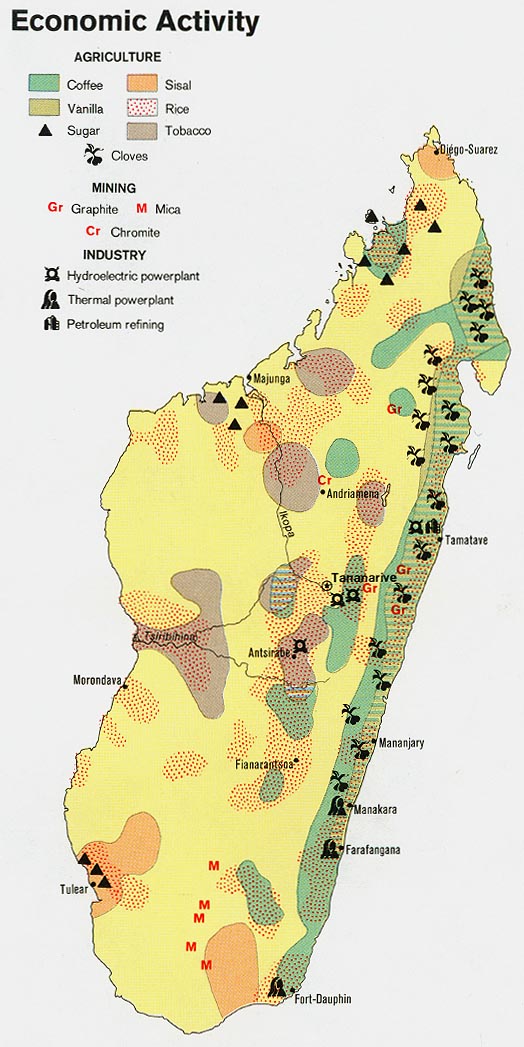
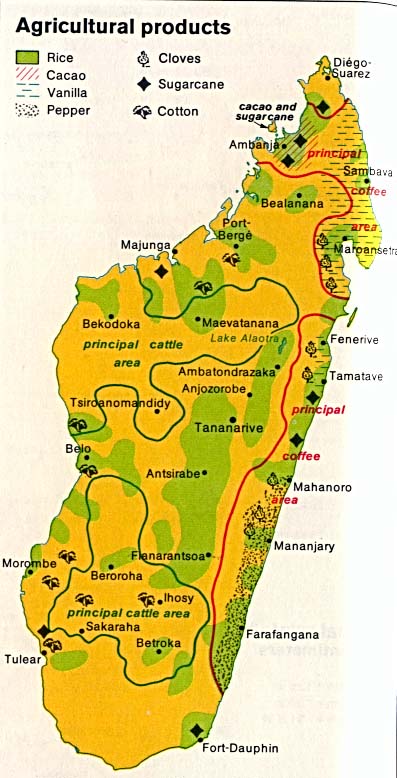
- Madagascar - Economic Activity 1973 (134K)
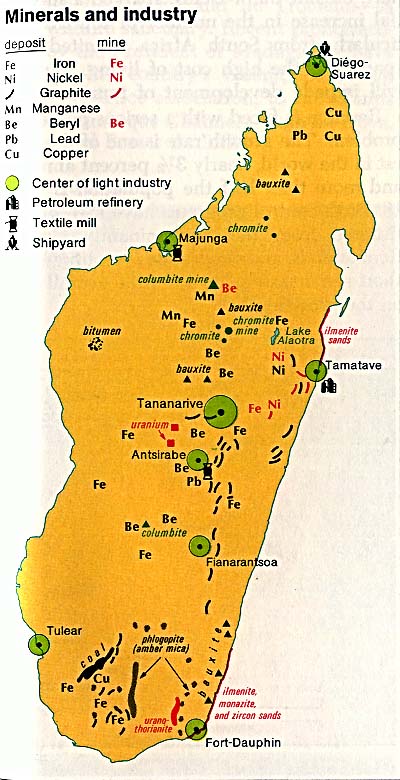
- Madagascar - Minerals and Industry from The Indian Ocean Atlas 1976 (76K)
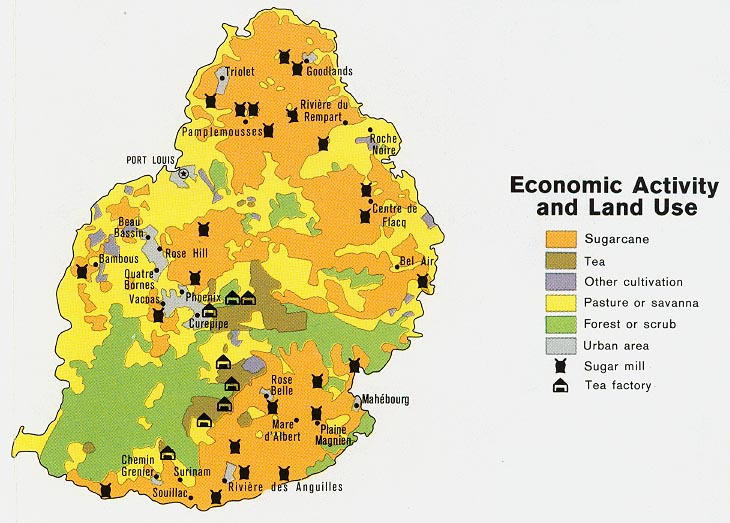
- Mauritius - Economic Activity and Land Use from Map No. 500430 1972 (114K)
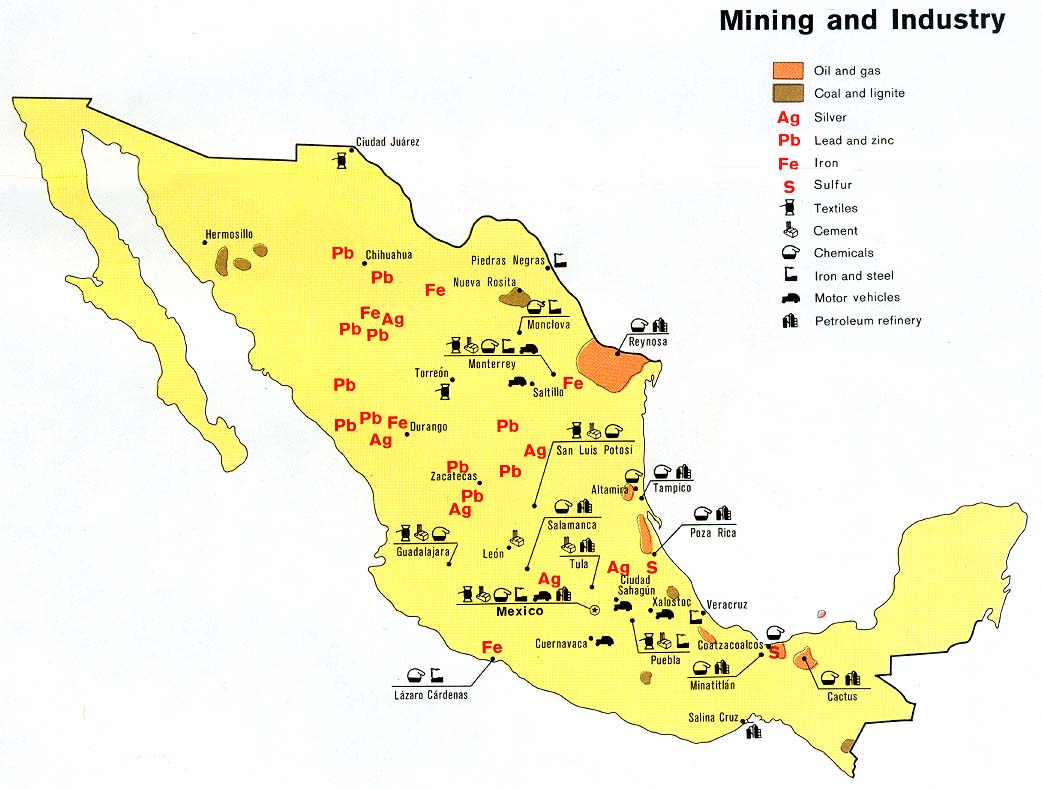
- Mexico - Mining and Industry from Map No. 503497 1978 (122K)
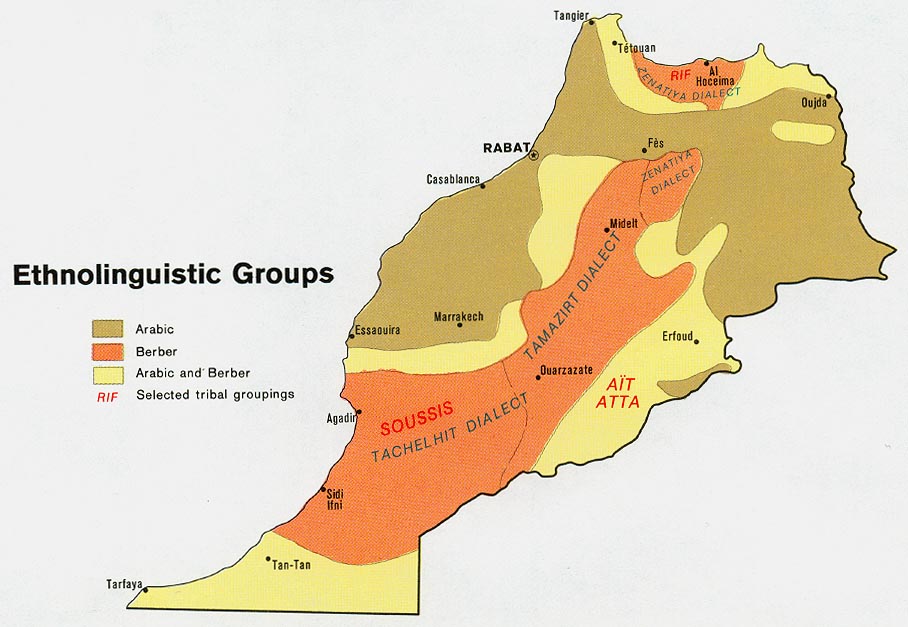
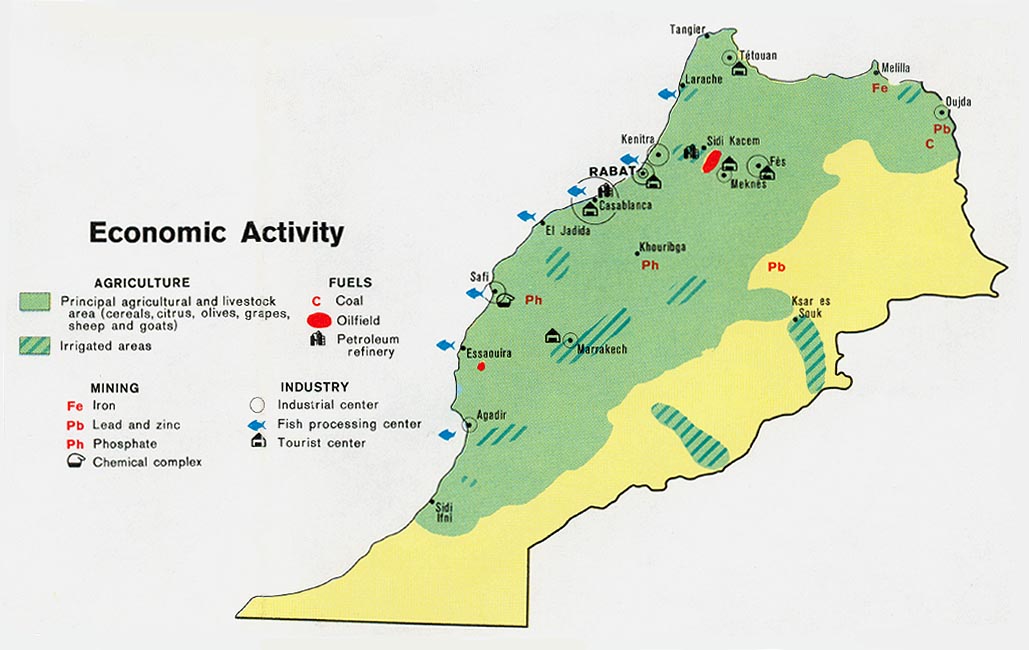
- Morocco - Economic Activity from Map No. 500977 1973 (106K)
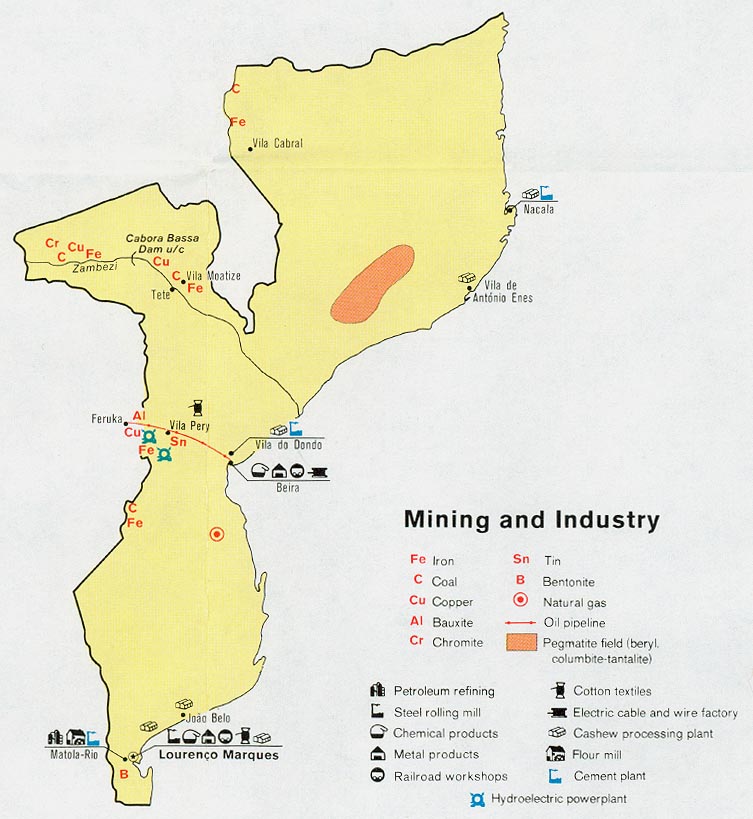
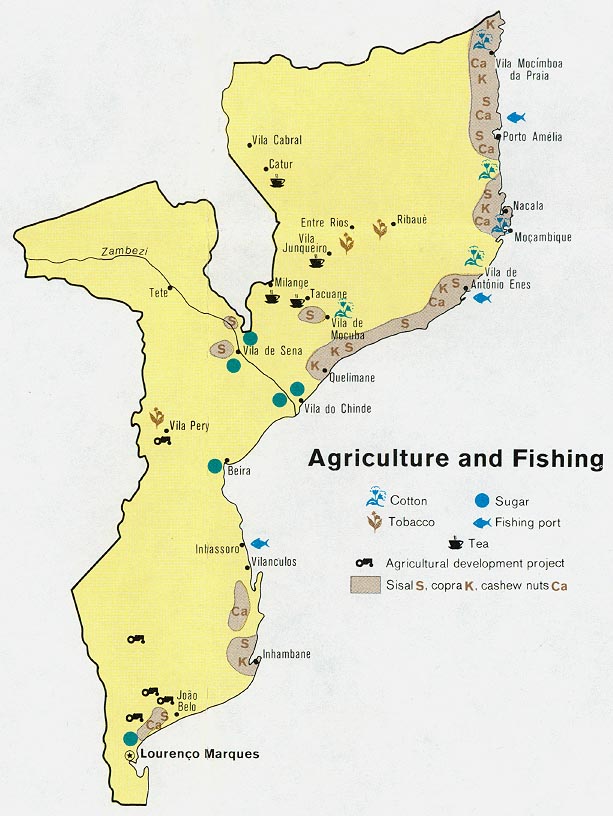
- Mozambique - Mining and Industry from Map No. 501370 1973 (113K)
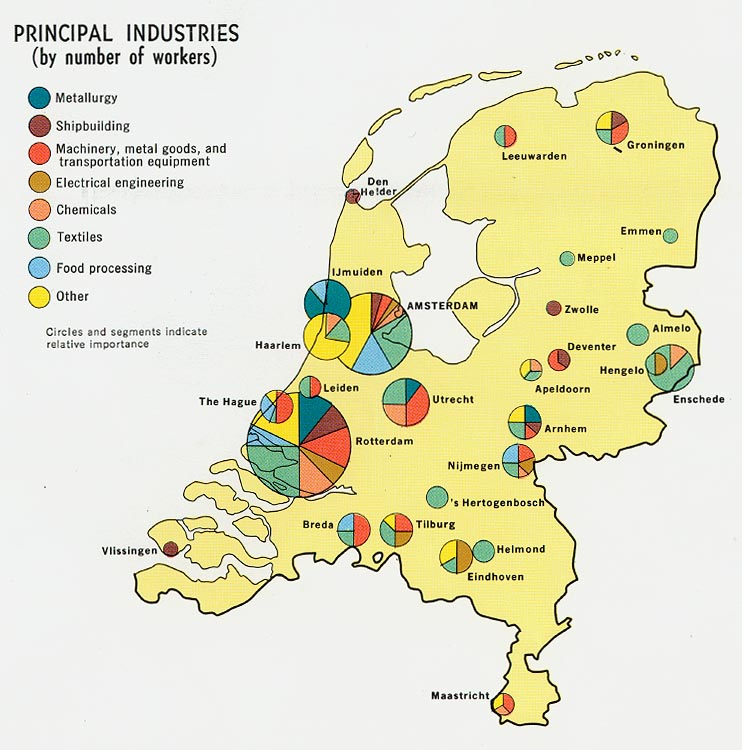
- Netherlands - Principal Industries from Map No. 76863 1970 (125K)
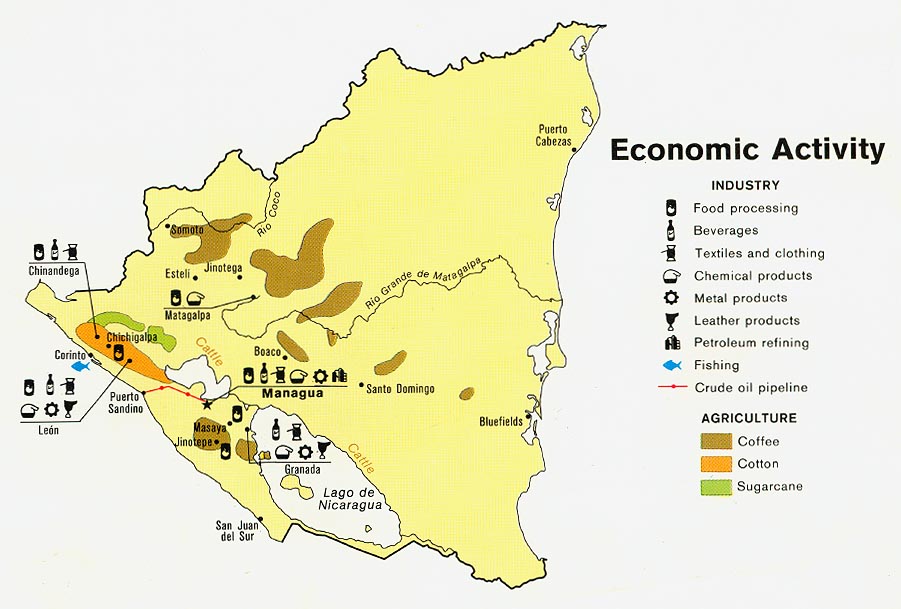
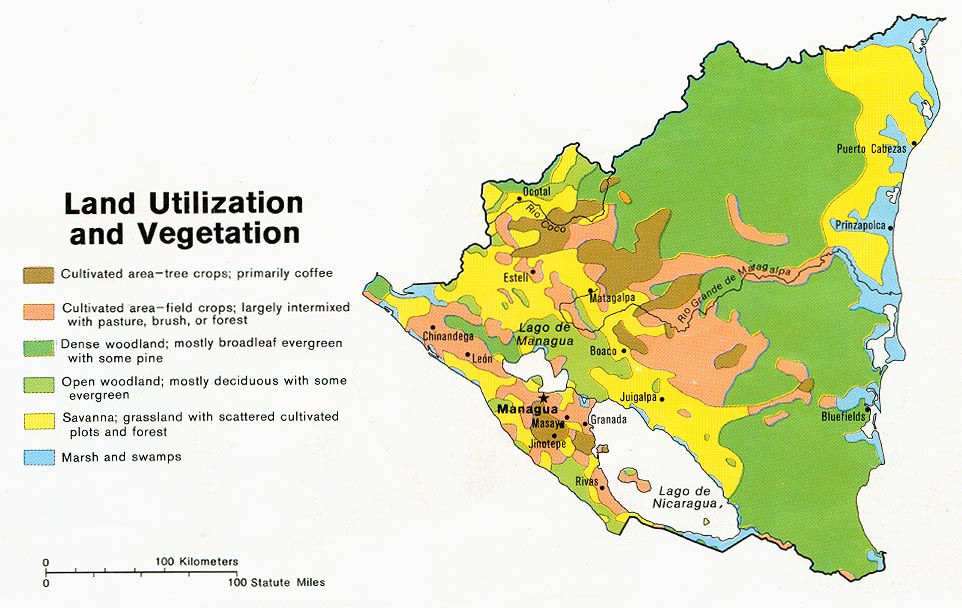
- Nicaragua - Economic Activity from Map No. 504012 1979 (107K)
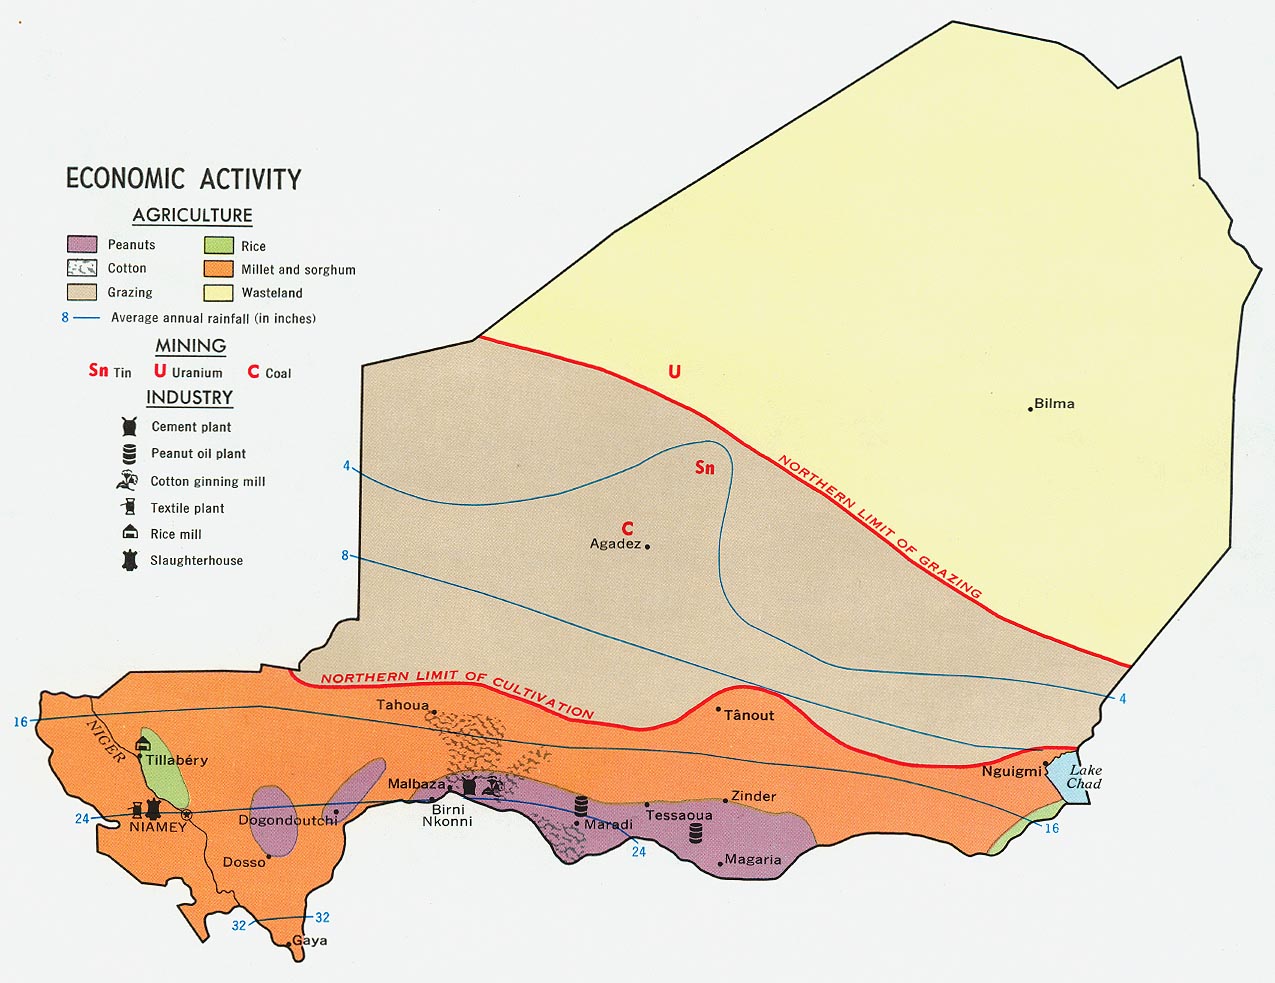
- Niger - Economic Activity from Map No. 59203 1969 (202K)
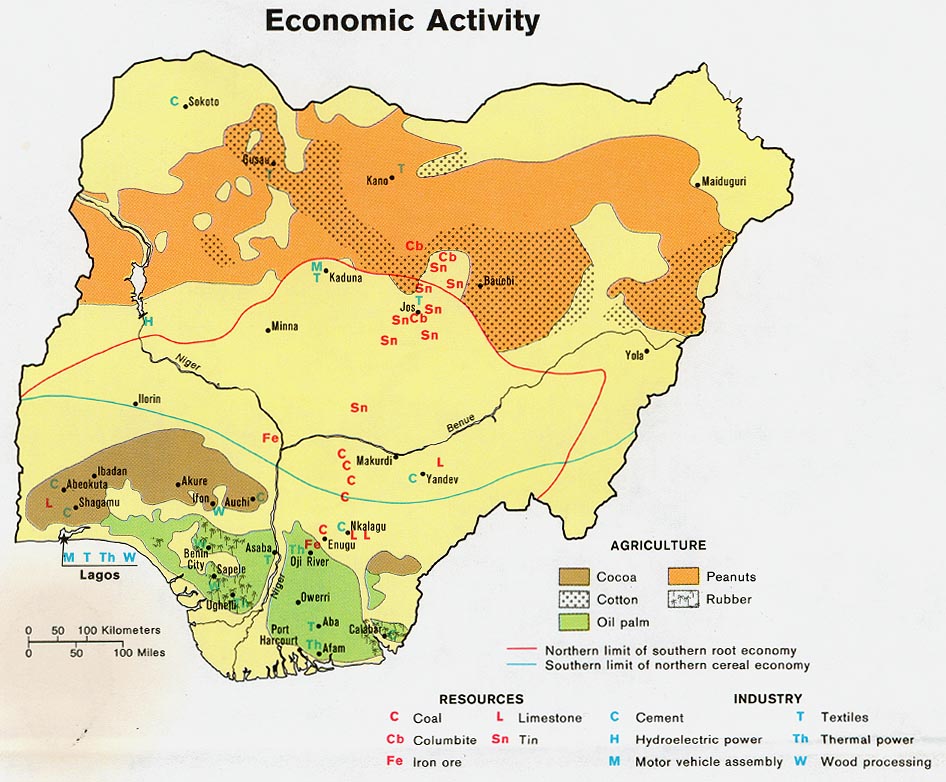
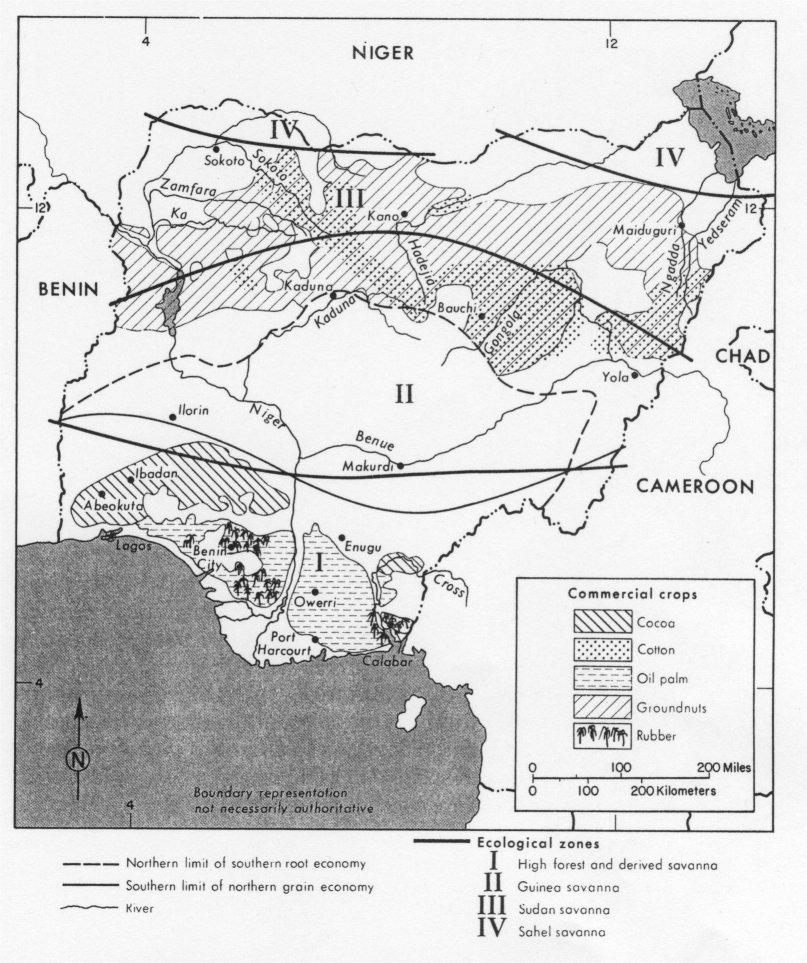
- Nigeria - Economic Activity from Map No. 504014 1979 (163K)
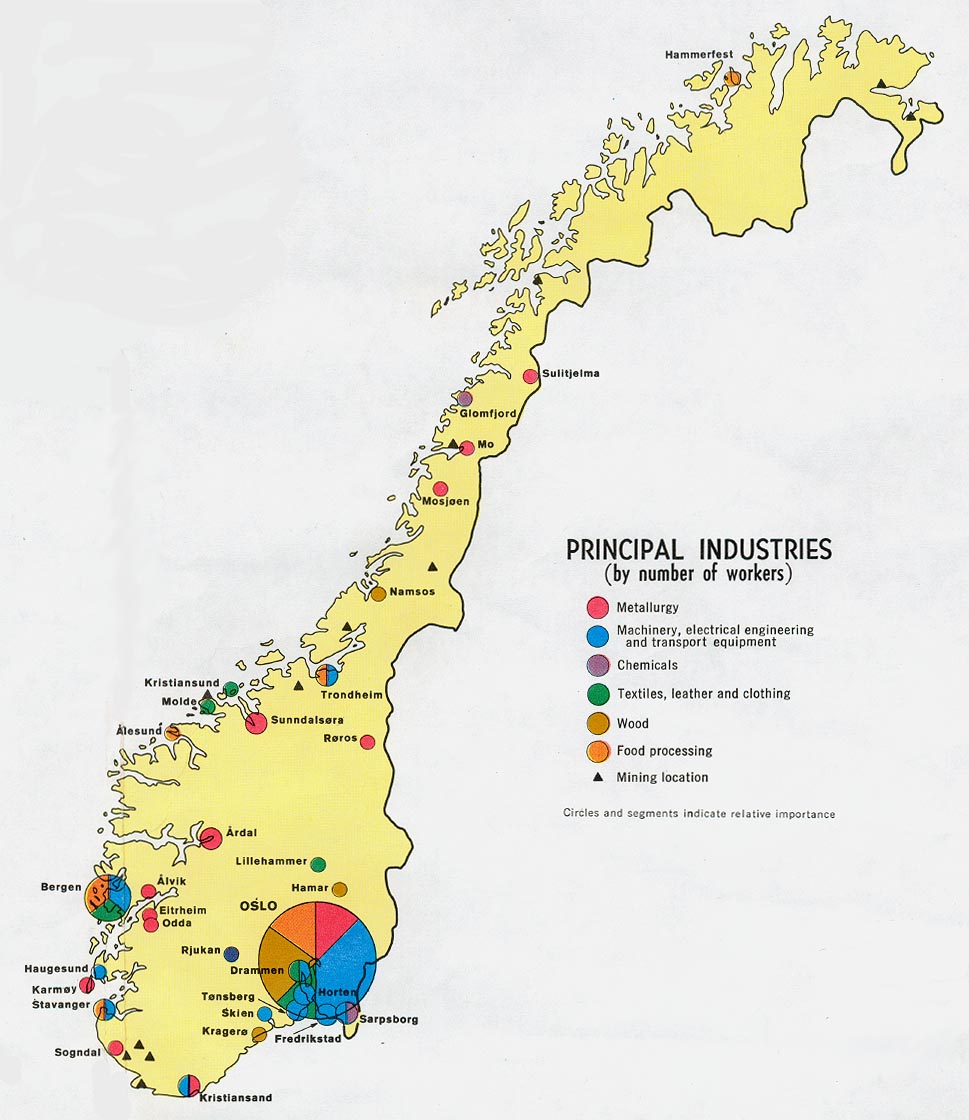
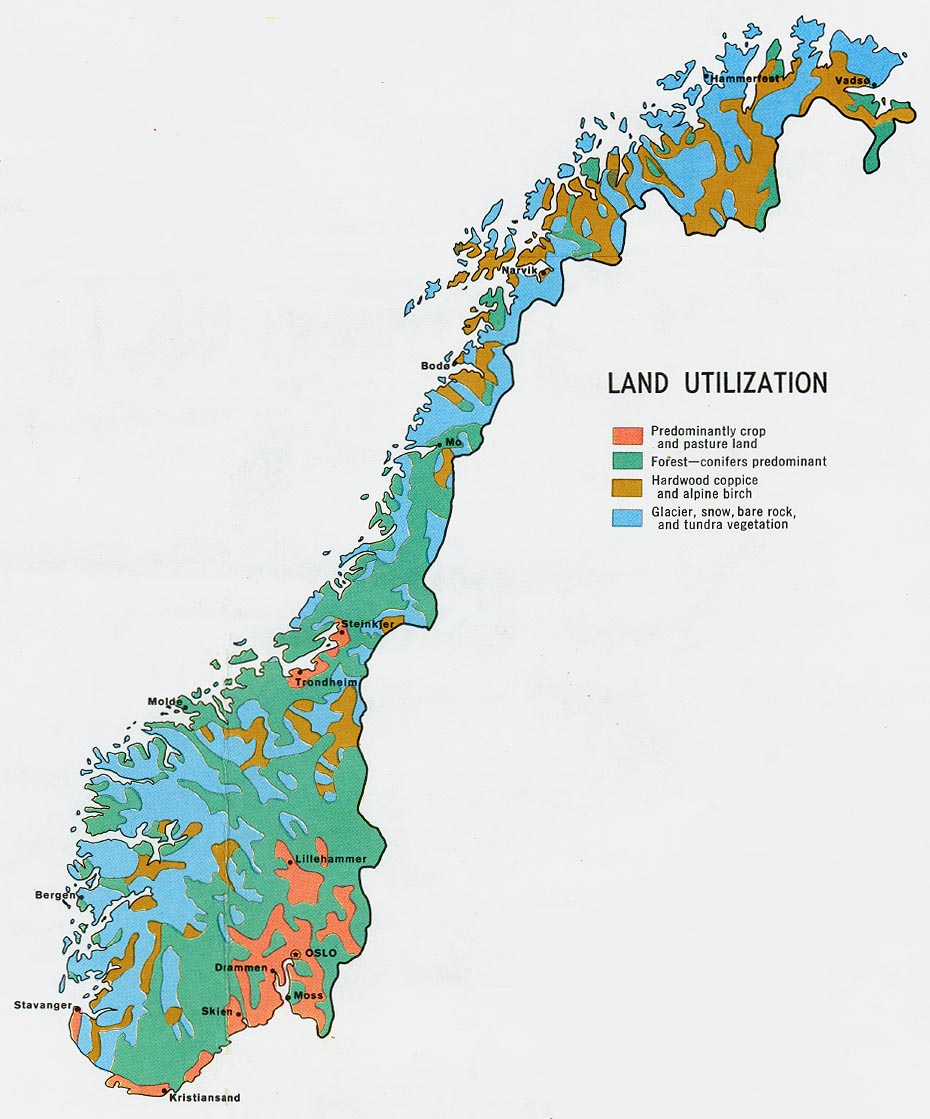
- Norway - Principal Industries from Map No. 500007 1971 (155K)
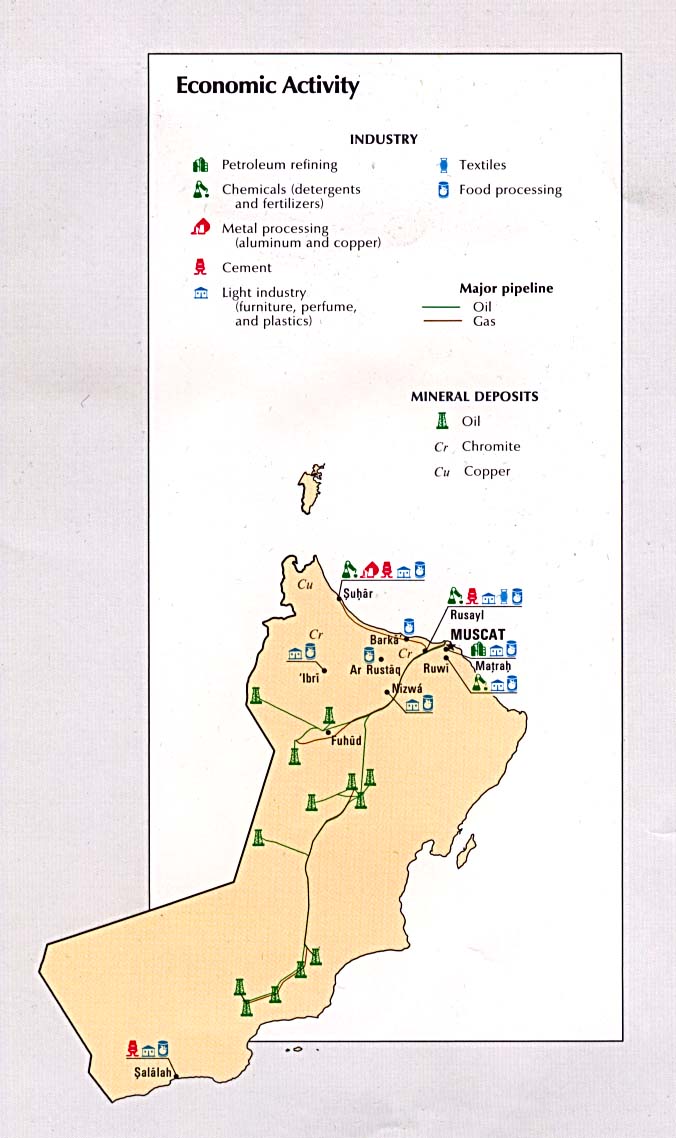
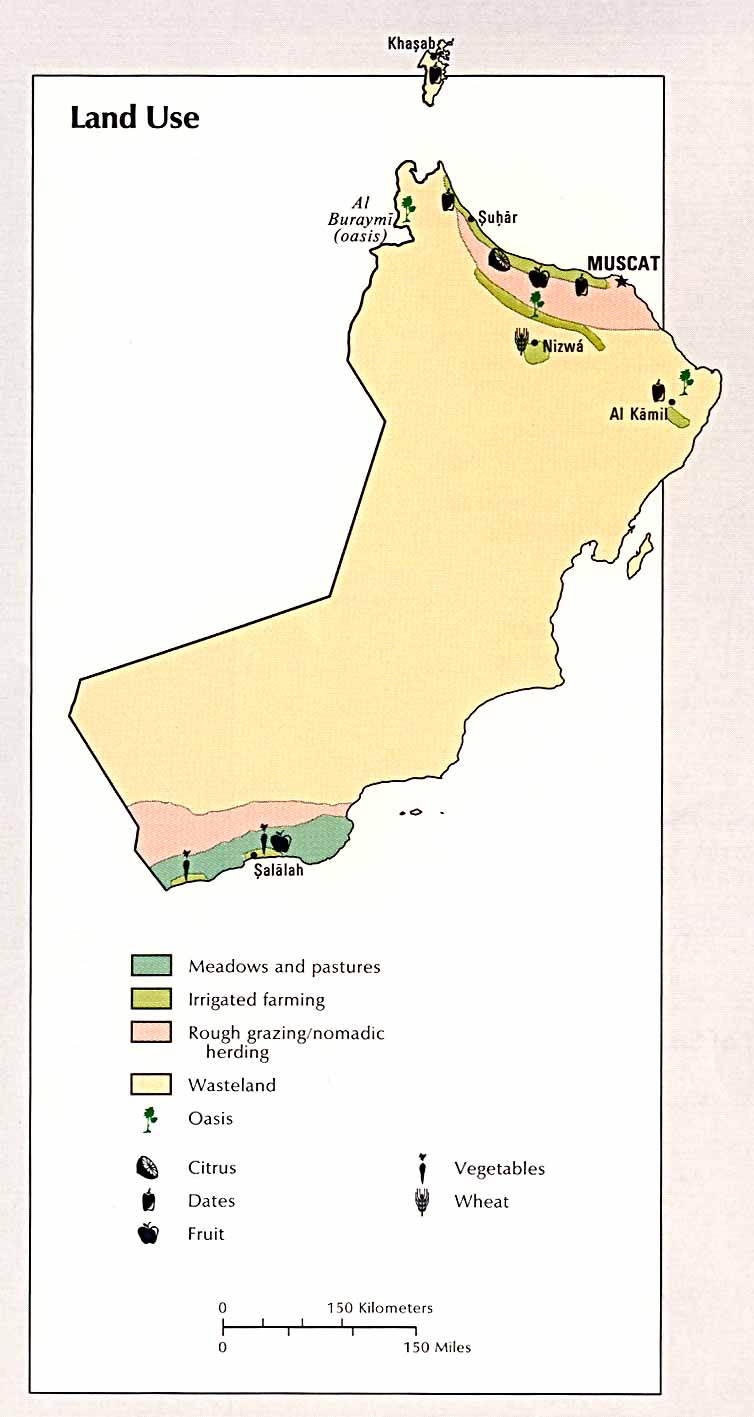
- Oman - Economic Activity from the CIA Atlas of the Middle East 1993 (124K)
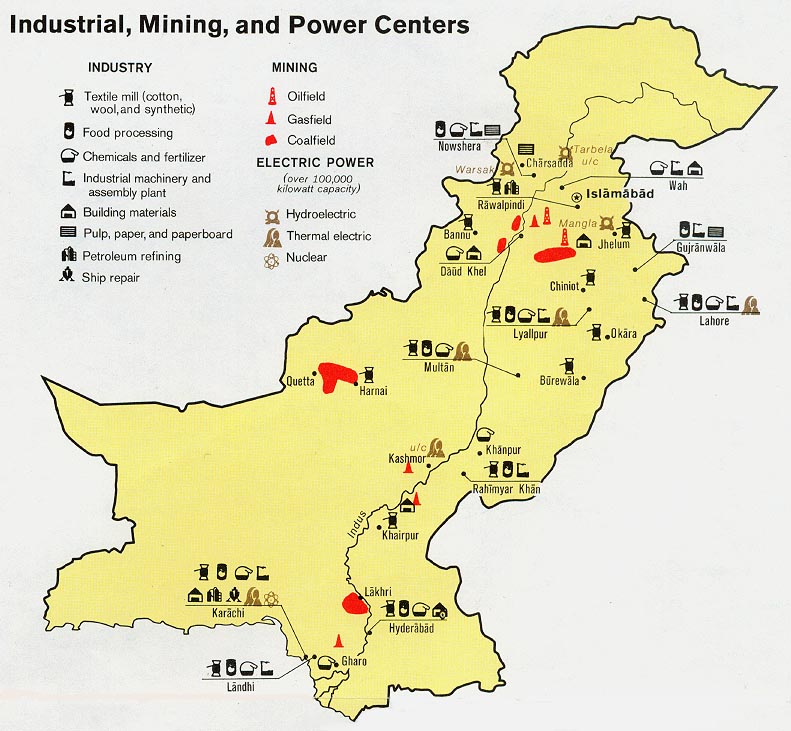
- Pakistan - Industry, Mining, Power Centers from Map No. 501383 1973 (137K)
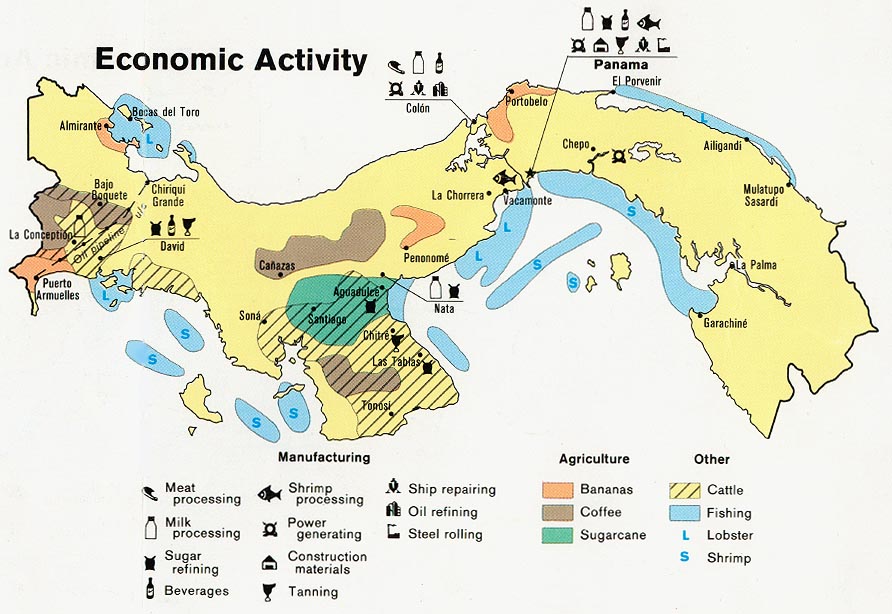
- Panama - Economic Activity from Map No. 545665 1981 (137K)
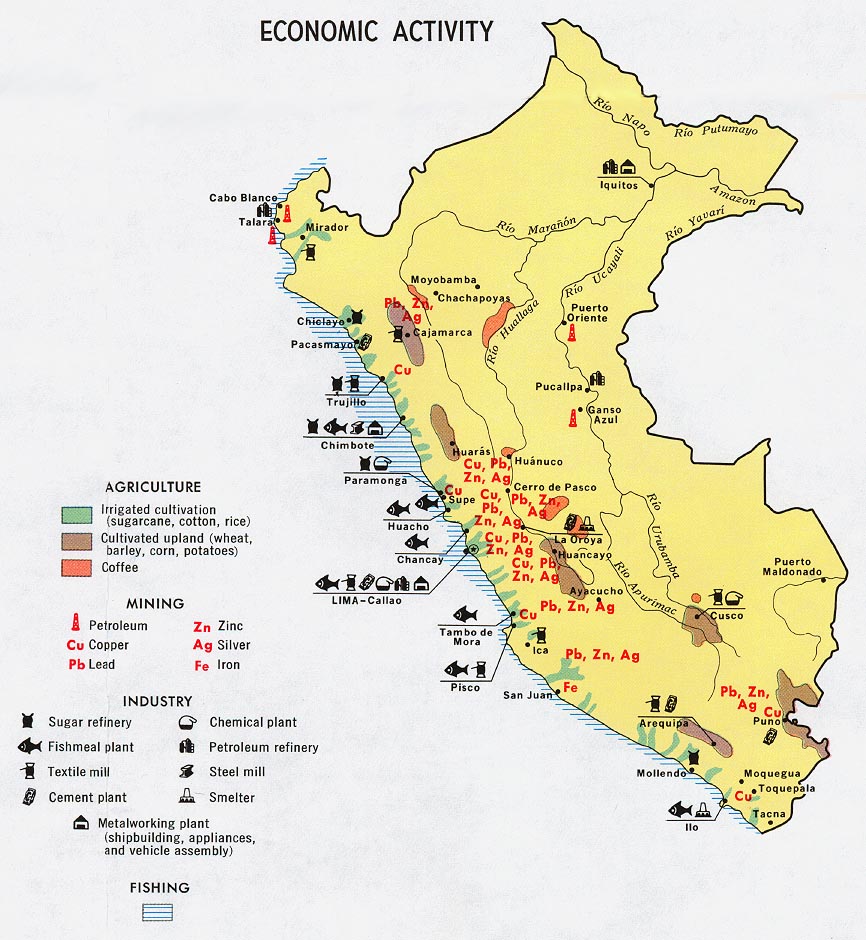
- Peru - Economic Activity from Map No. 76868 1970 (182K)
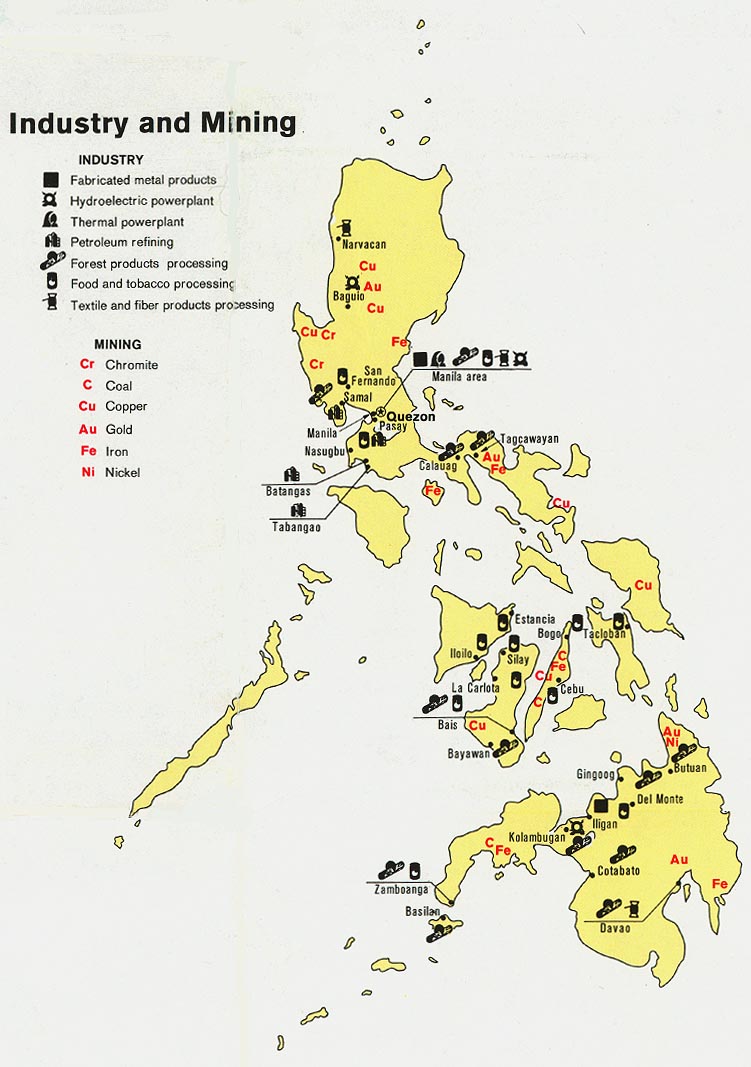
- Philippines - Industry and Mining from Map No. 501475 1973 (137K)
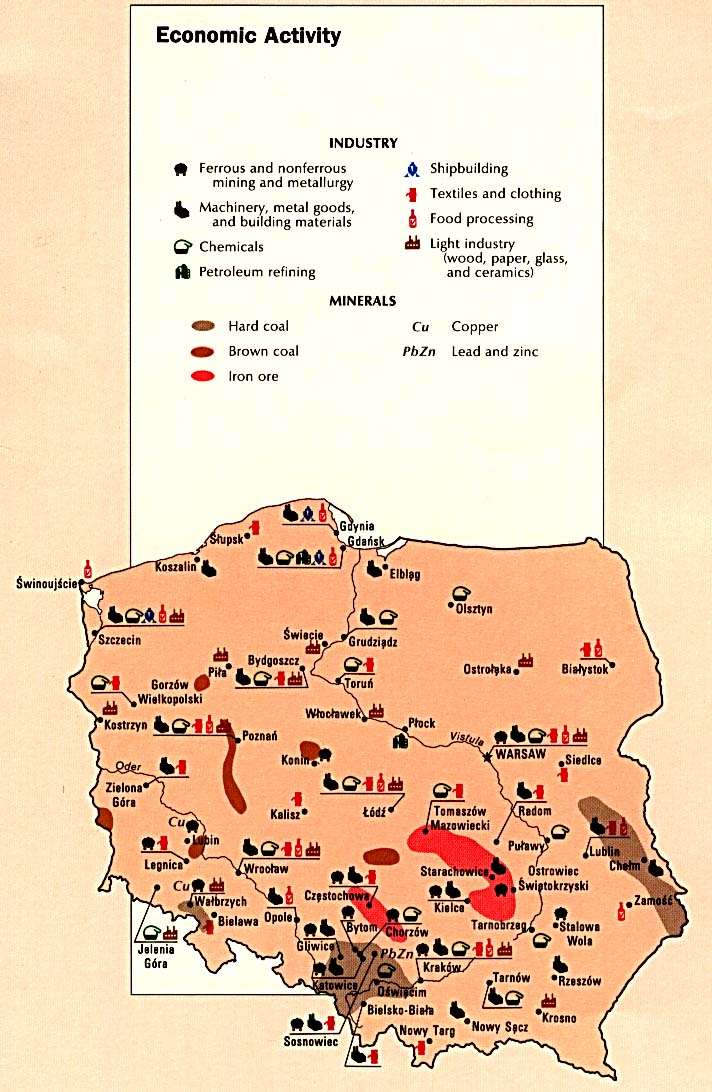
- Poland - Economic Activity from the CIA Atlas of Eastern Europe 1990 (141K)
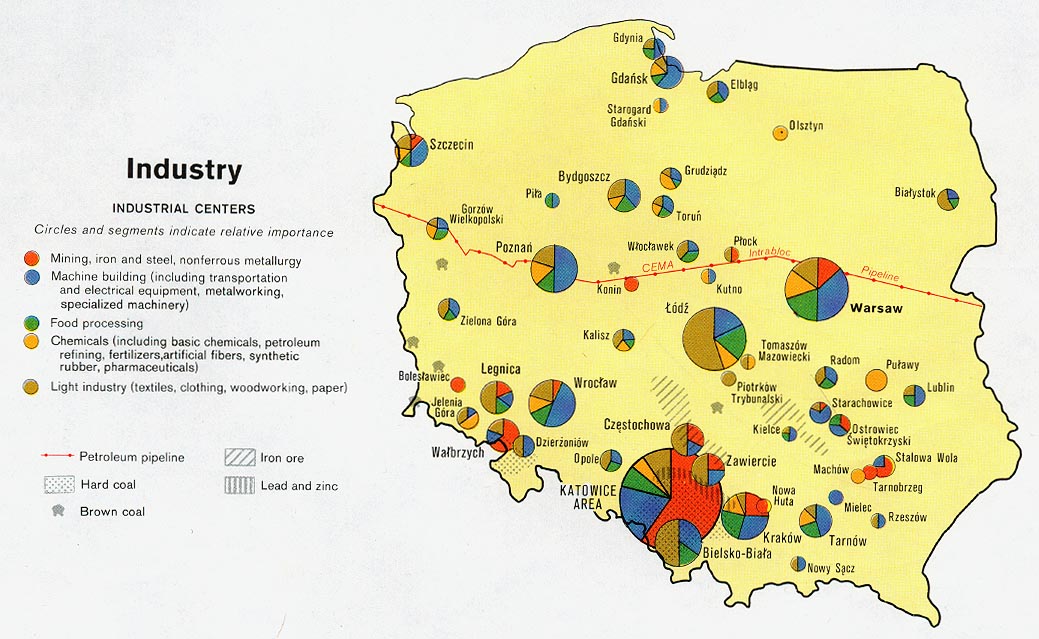
- Poland - Industry from Map No. 503478 1977 (160K)
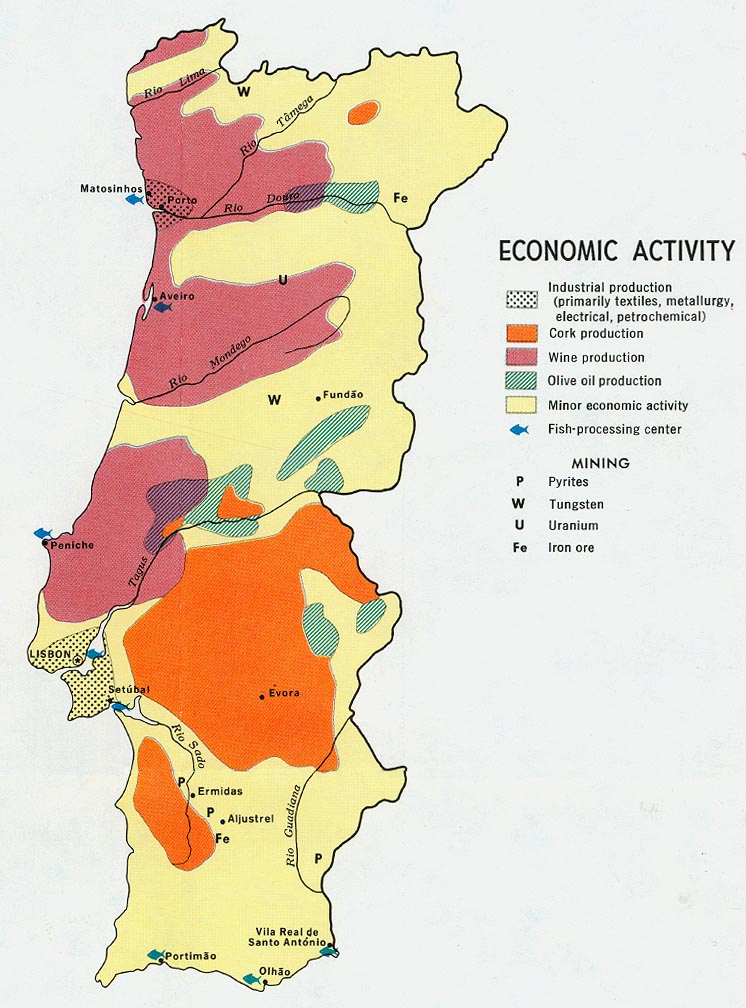
- Portugal - Economic Activity from Map No. 500530 1972 (156K)
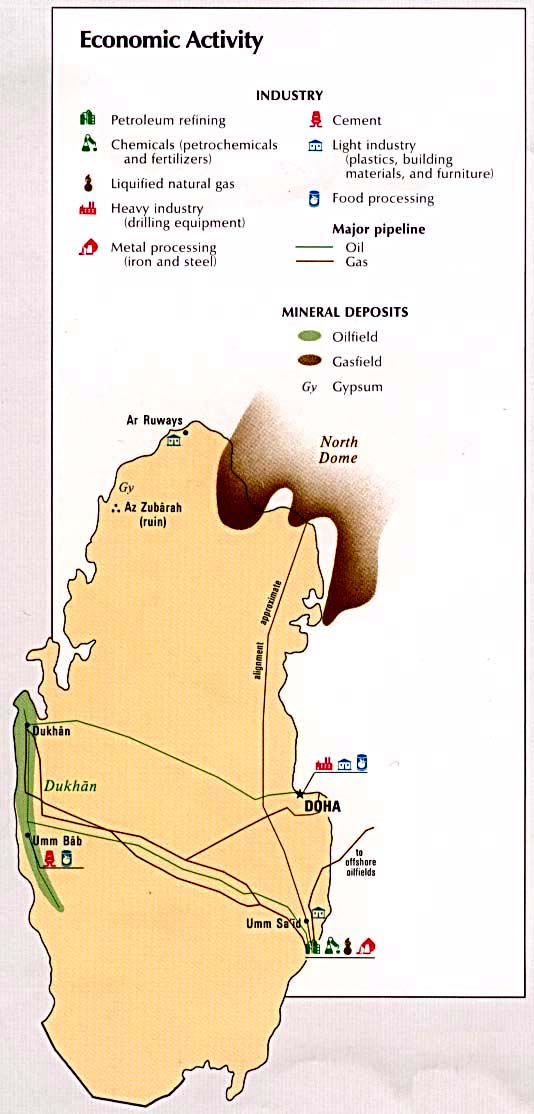
- Qatar - Economic Activity from the CIA Atlas of the Middle East 1993 (76K)
- Romania - Economic Activity from the CIA Atlas of Eastern Europe 1990 (127K)
- Romania - Industrial Centers from Map No. 76858 1970 (172K)
- [Russia] Soviet Union - Machine Building and Metal Working from Map No. 501614 1974 (154K)
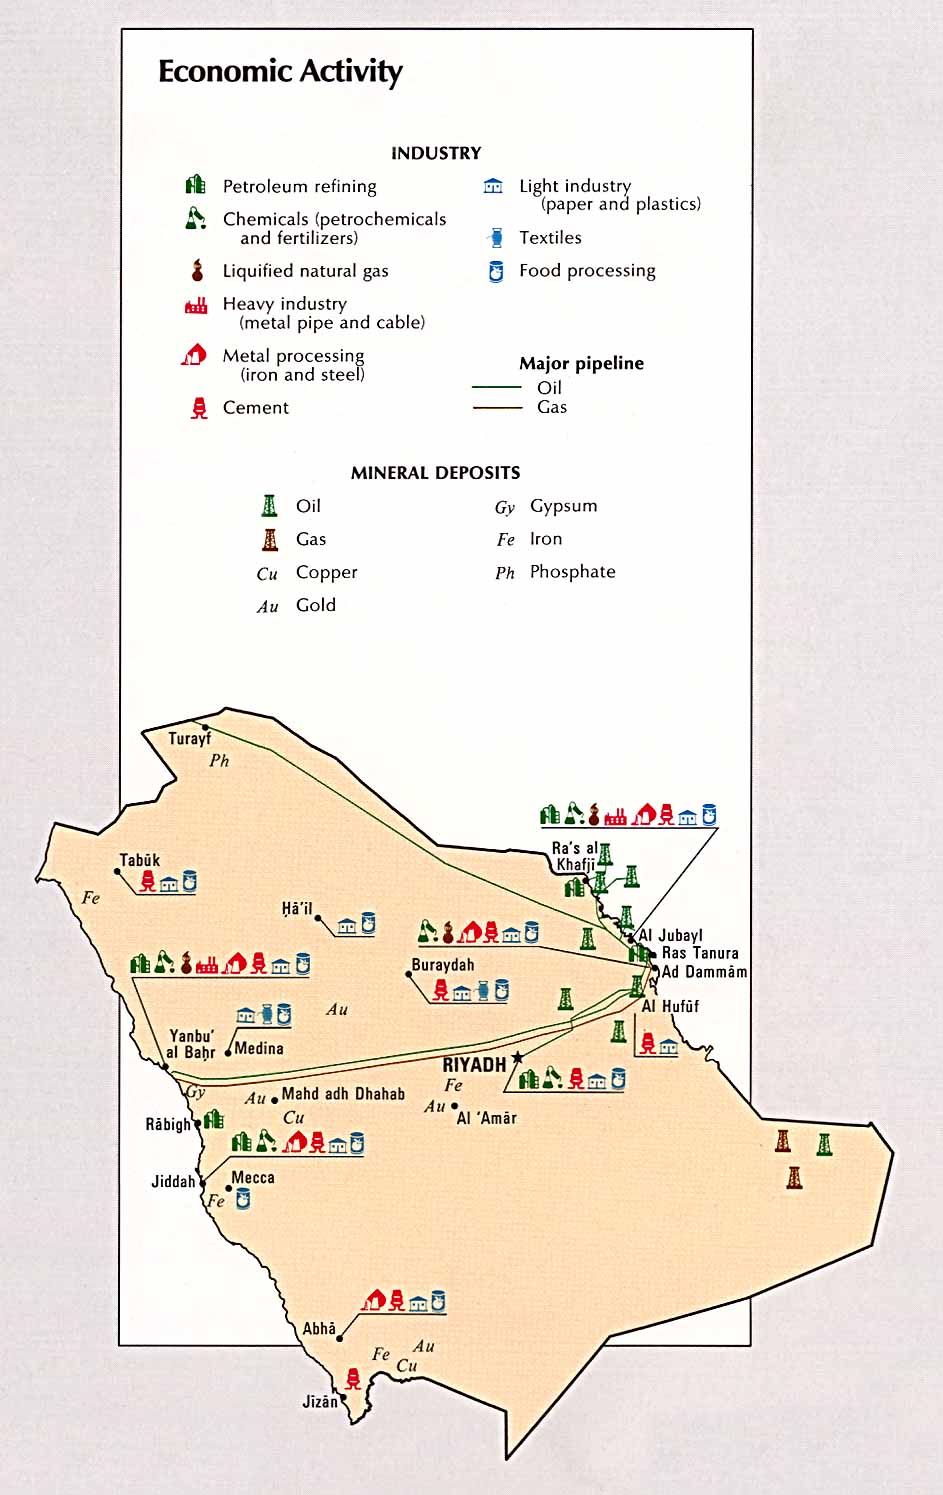
- Saudi Arabia - Economic Activity from the CIA Atlas of the Middle East 1993 (120K)
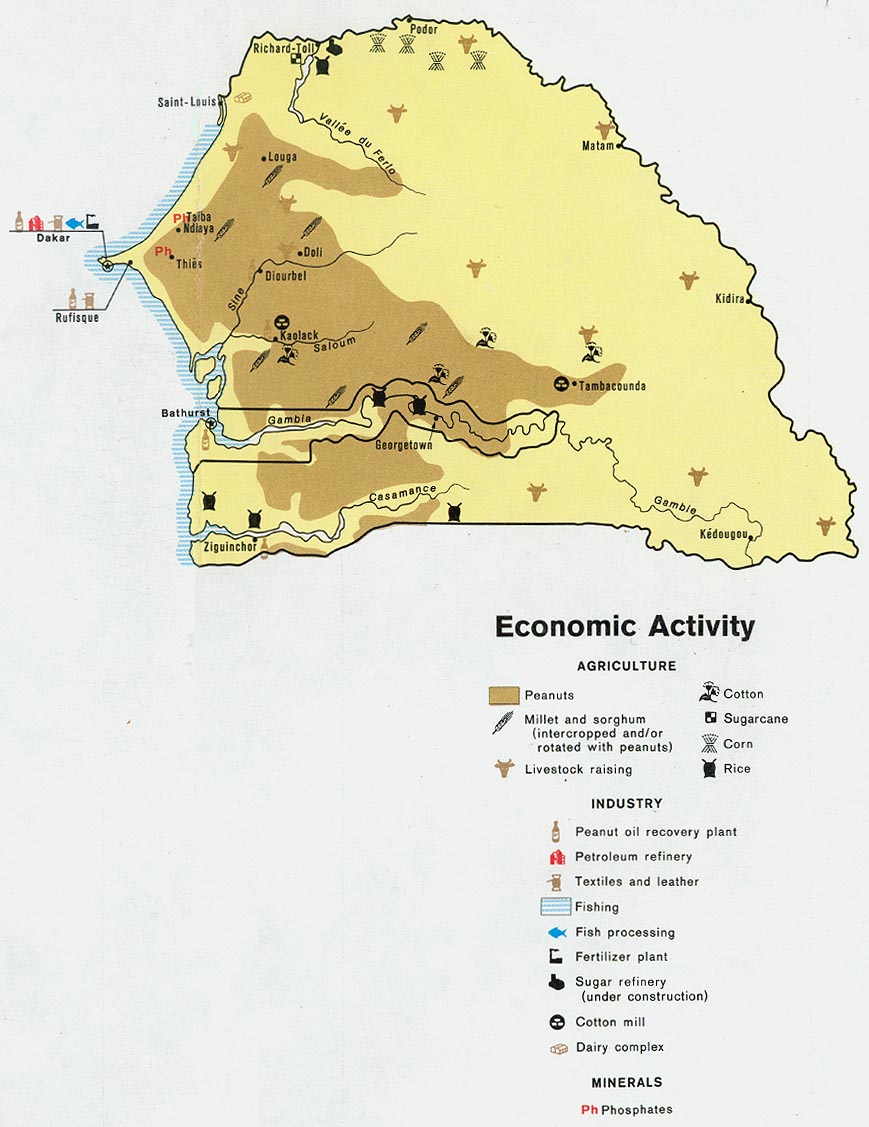
- Senegal and Gambia - Evonomic Activity from Map No. 500708 1972 (148K)
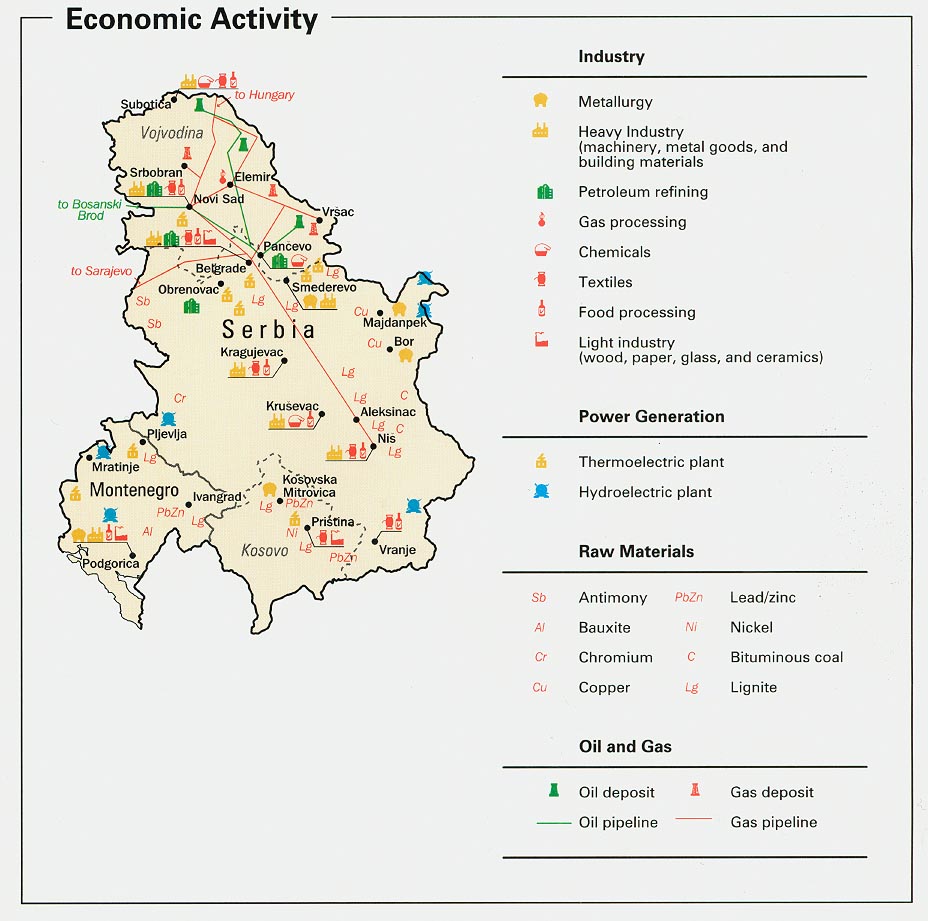
- Serbia and Montenegro - Economic Activity from Map No. 802165 1993 (154K)
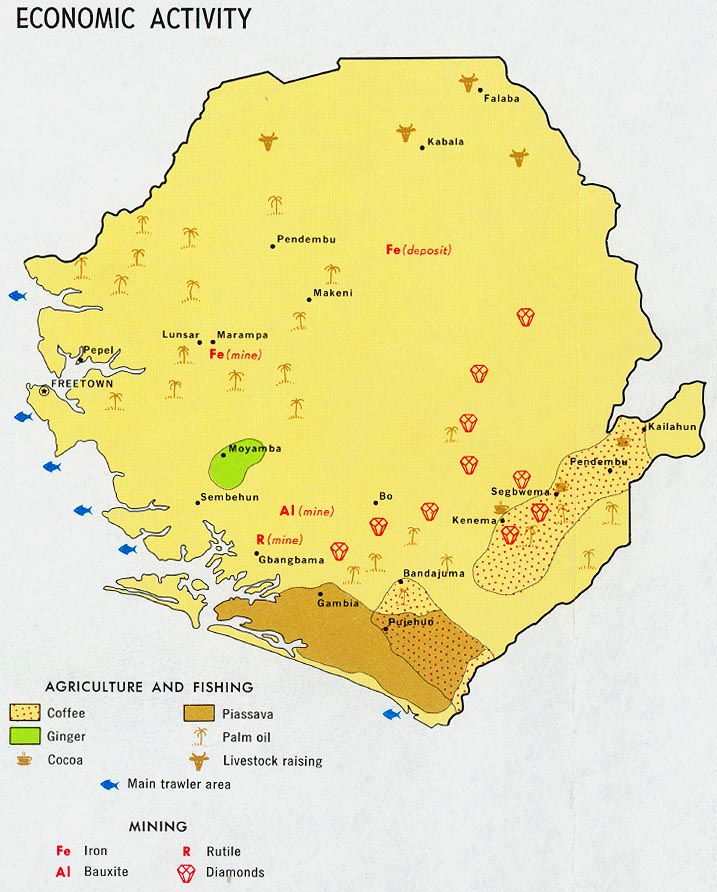
- Sierra Leone - Economic Activity from Map No. 58962 1969 (137K)
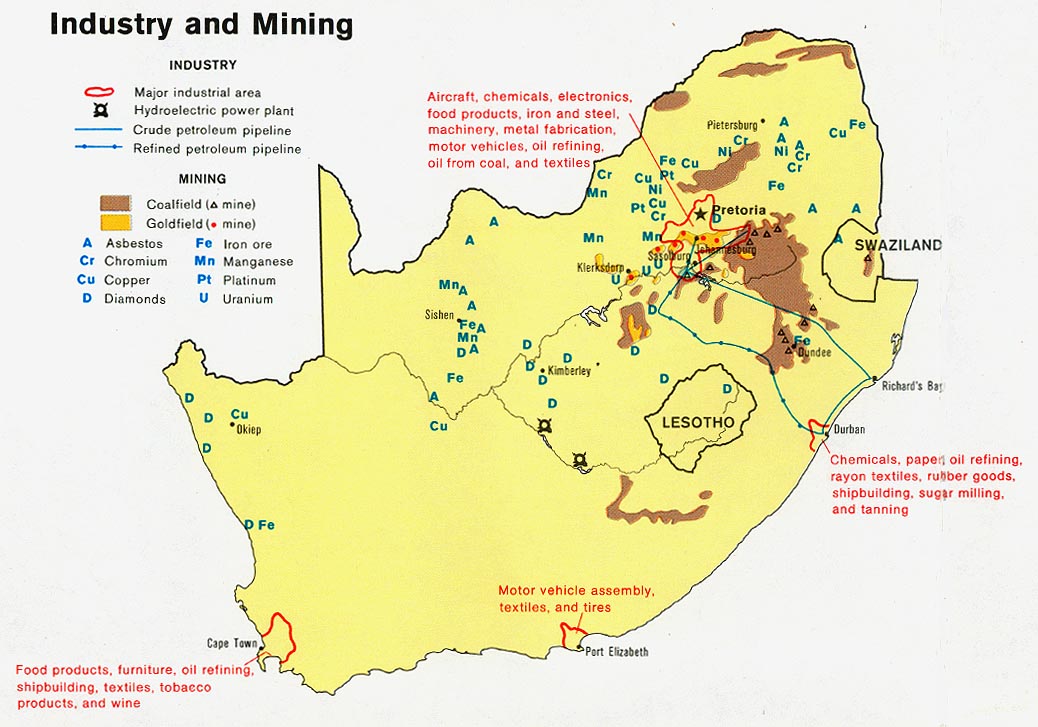
- South Africa - Industry and Mining from Map No. 503971 1979 (149K)
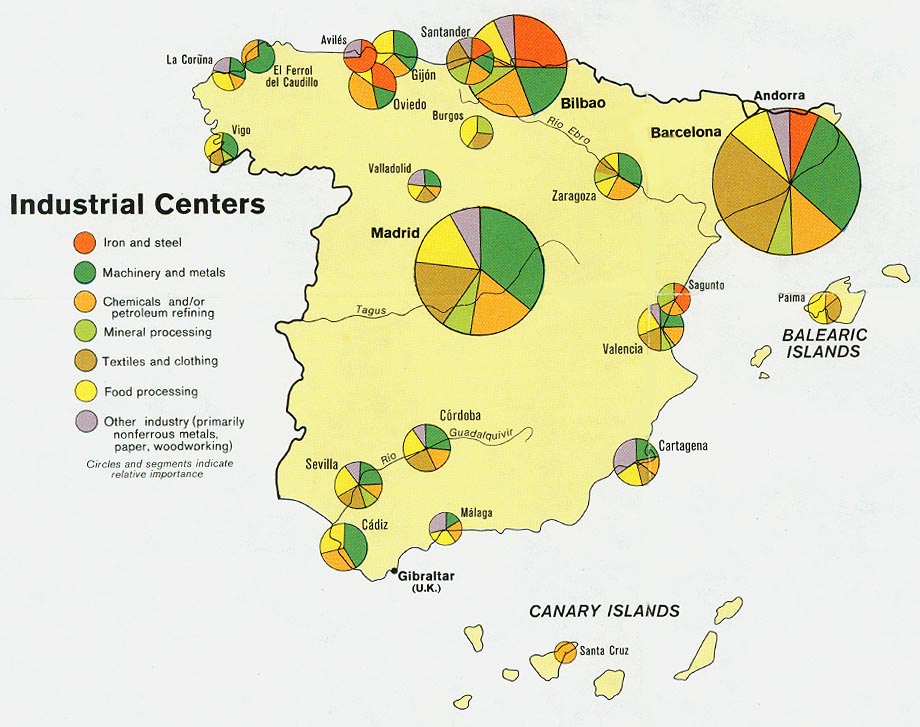
- Spain - Industrial Centers from Map No. 501745 1974 (134K)
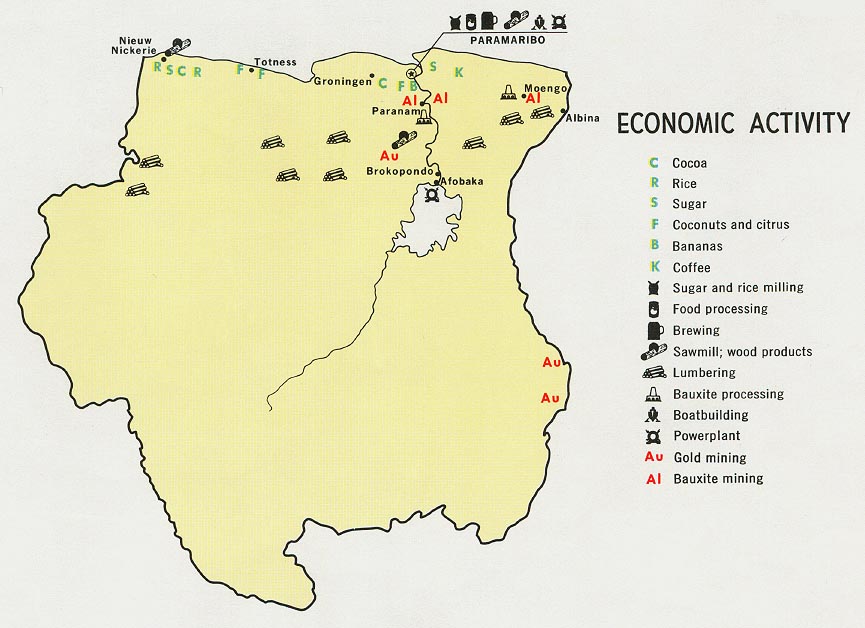
- Suriname - Economic Activity from Map No. 56828 1968 (98K)
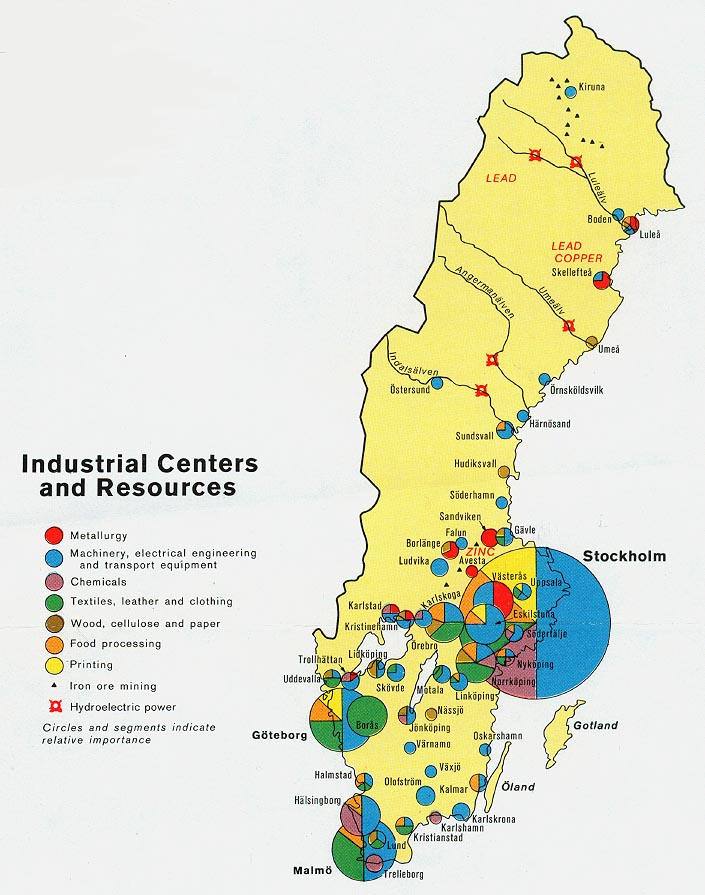
- Sweden - Industrial Centers from Map No. 500866 1973 (137K)
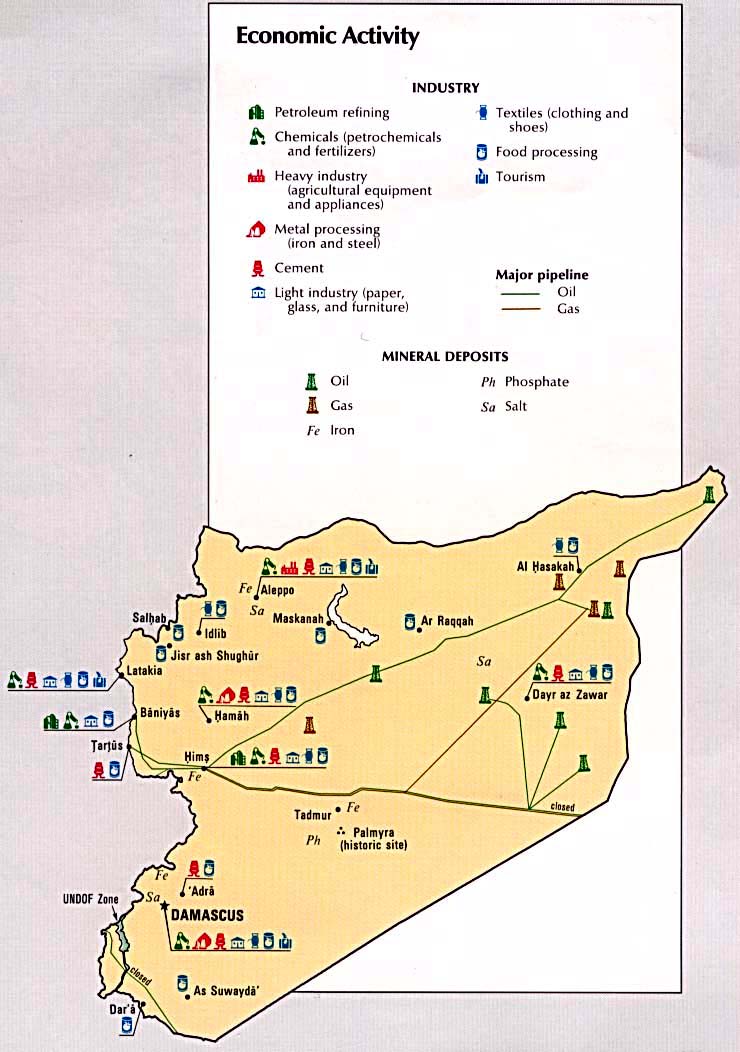
- Syria - Economic Activity from the CIA Atlas of the Middle East 1993 (103K)
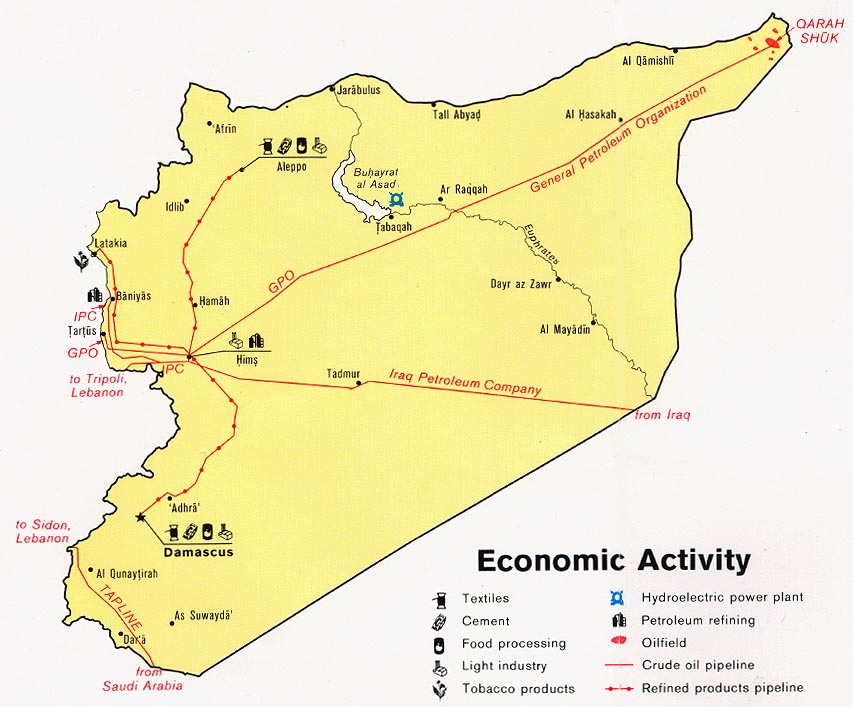
- Syria - Economic Activity from Map No. 503966 1979 (115K)
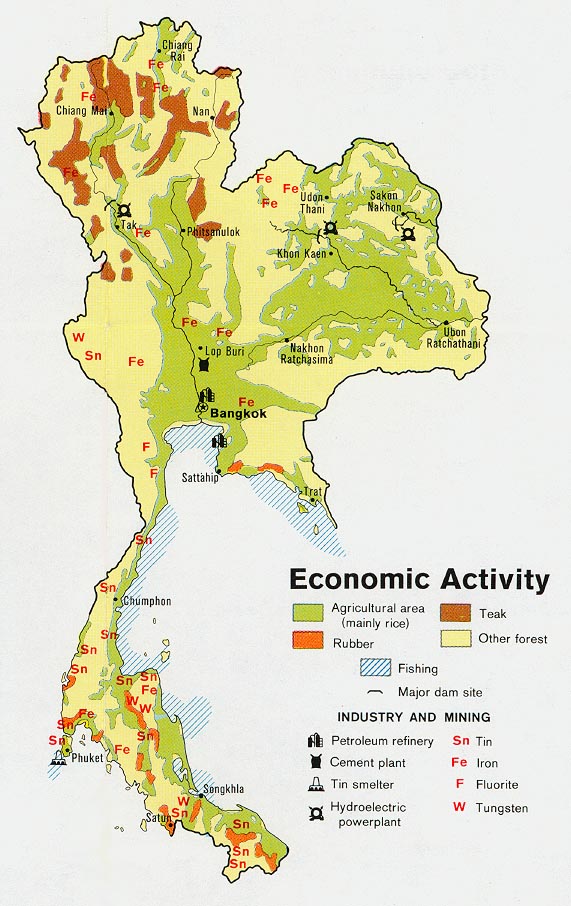
- Thailand - Economic Activity from Map No. 501551 1974 (134K)
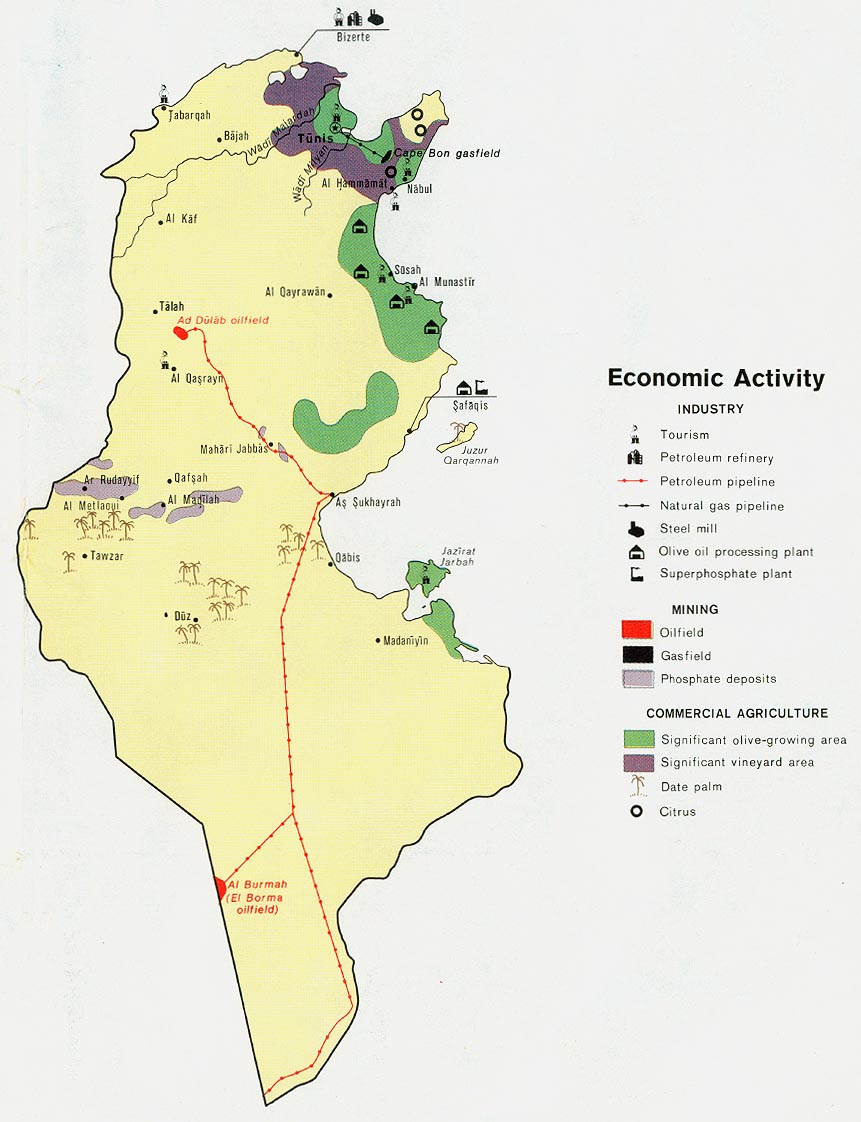
- Tunisia - Economic Activity from Map No. 500587 1972 (134K)
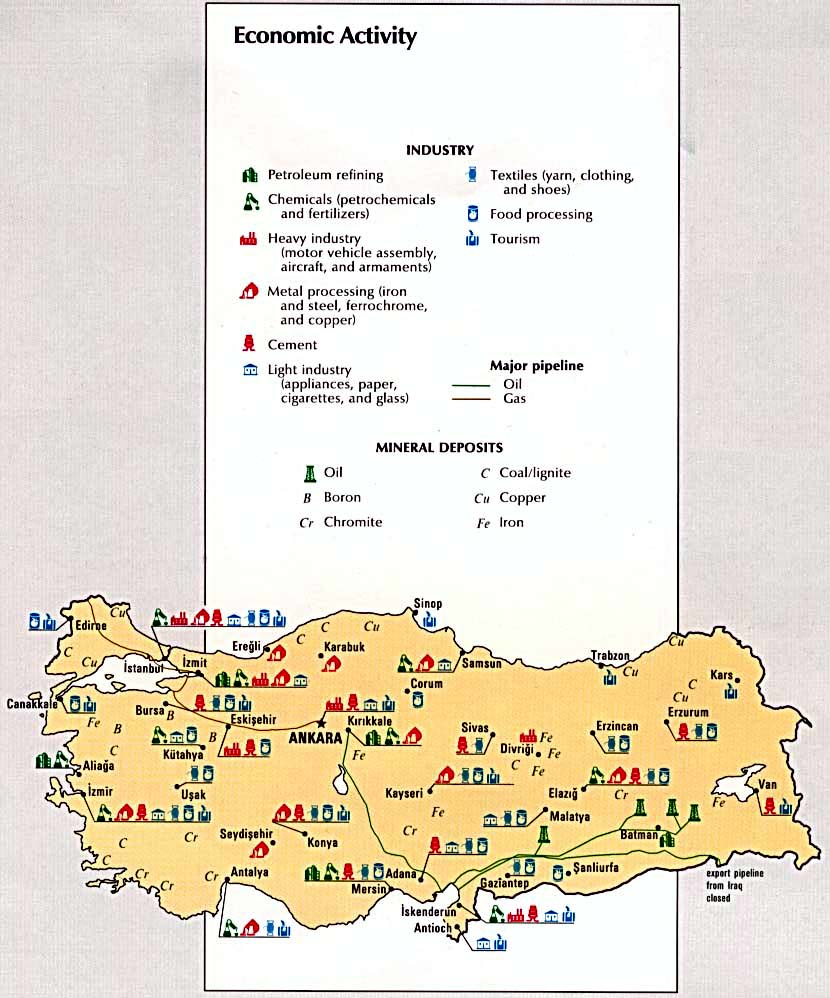
- Turkey - Economic Activity from the CIA Atlas of the Middle East 1993 (126K)
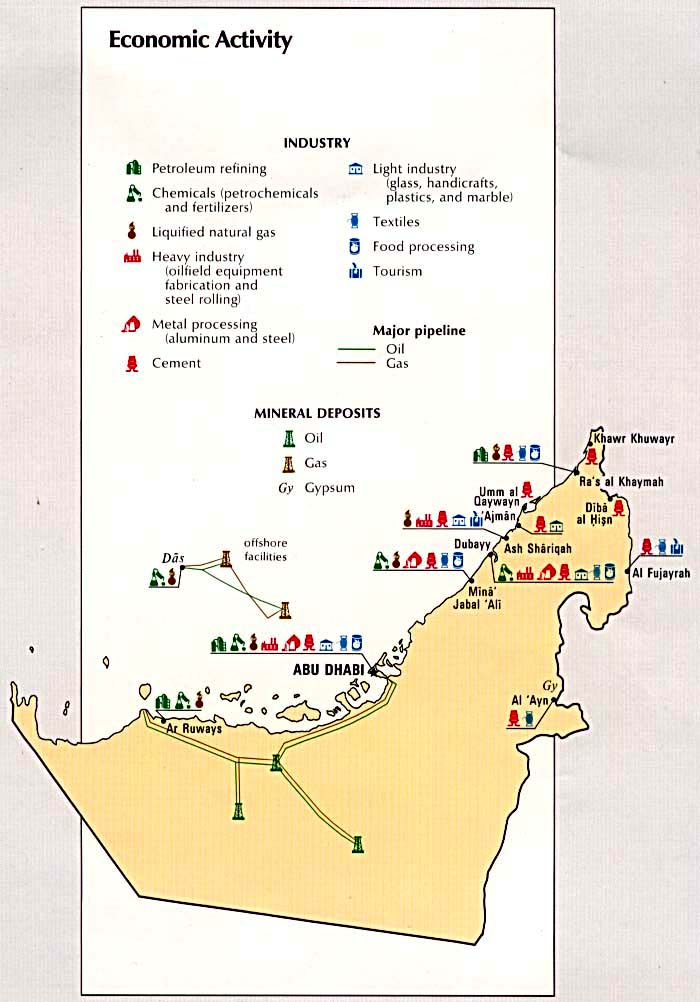
- United Arab Emirates - Economic Activity from the CIA Atlas of the Middle East 1993 (87K)
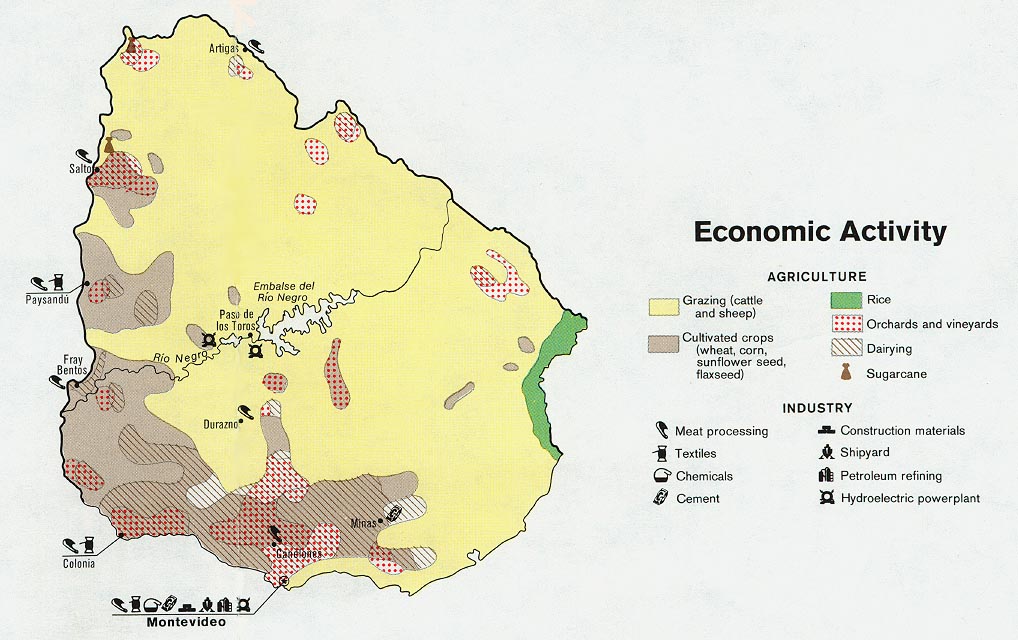
- Uruguay - Economic Activity 1974 (140K)
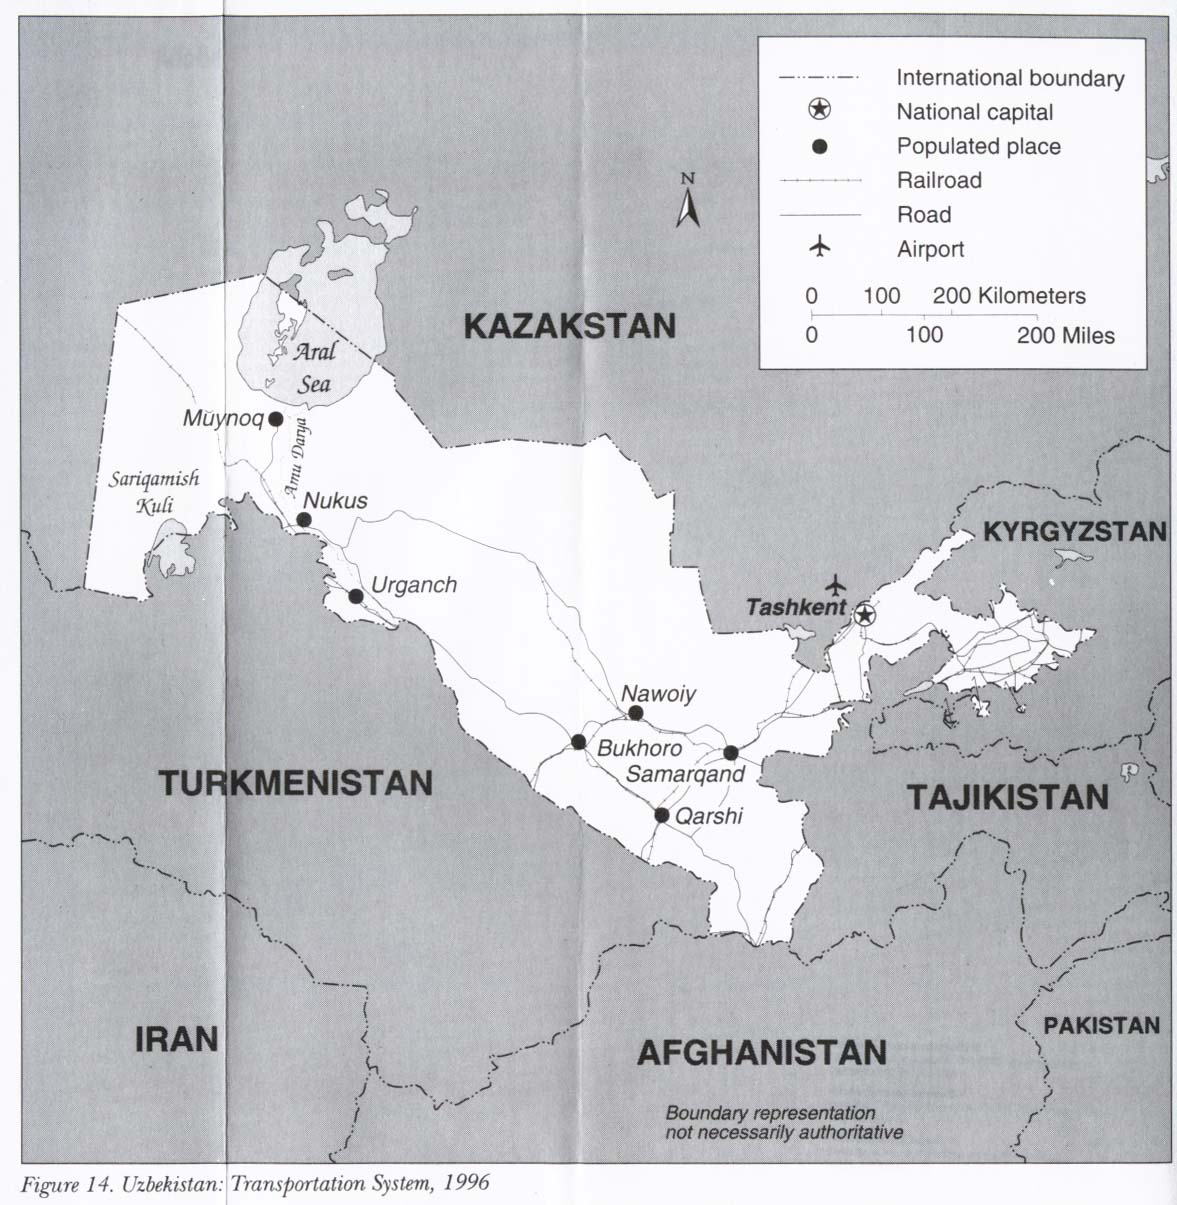
- Uzbekistan - Transportation System 1996 from Kazakstan, Kyrgyzstan, Tajikistan, Turkmenistan, and Uzbekistan: Country Studies. 1997 (150K)
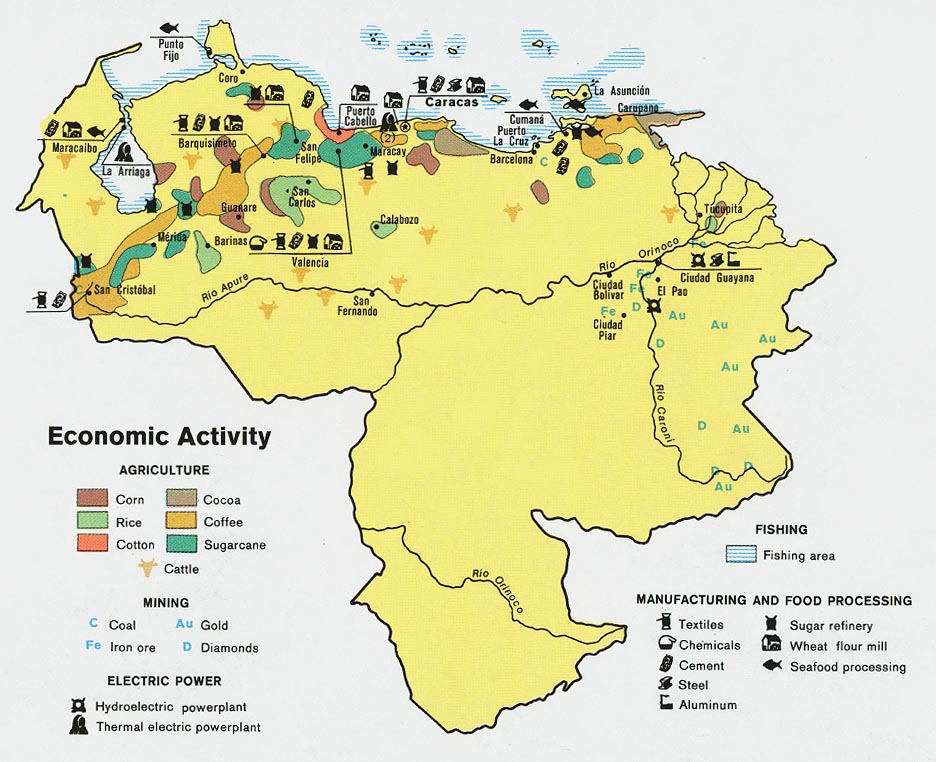
- Venezuela - Economic Activity from Map No. 500516 1972 (158K)
- Vietnam [South] - Economic Activity from Map No. 500874 1972 (140K)
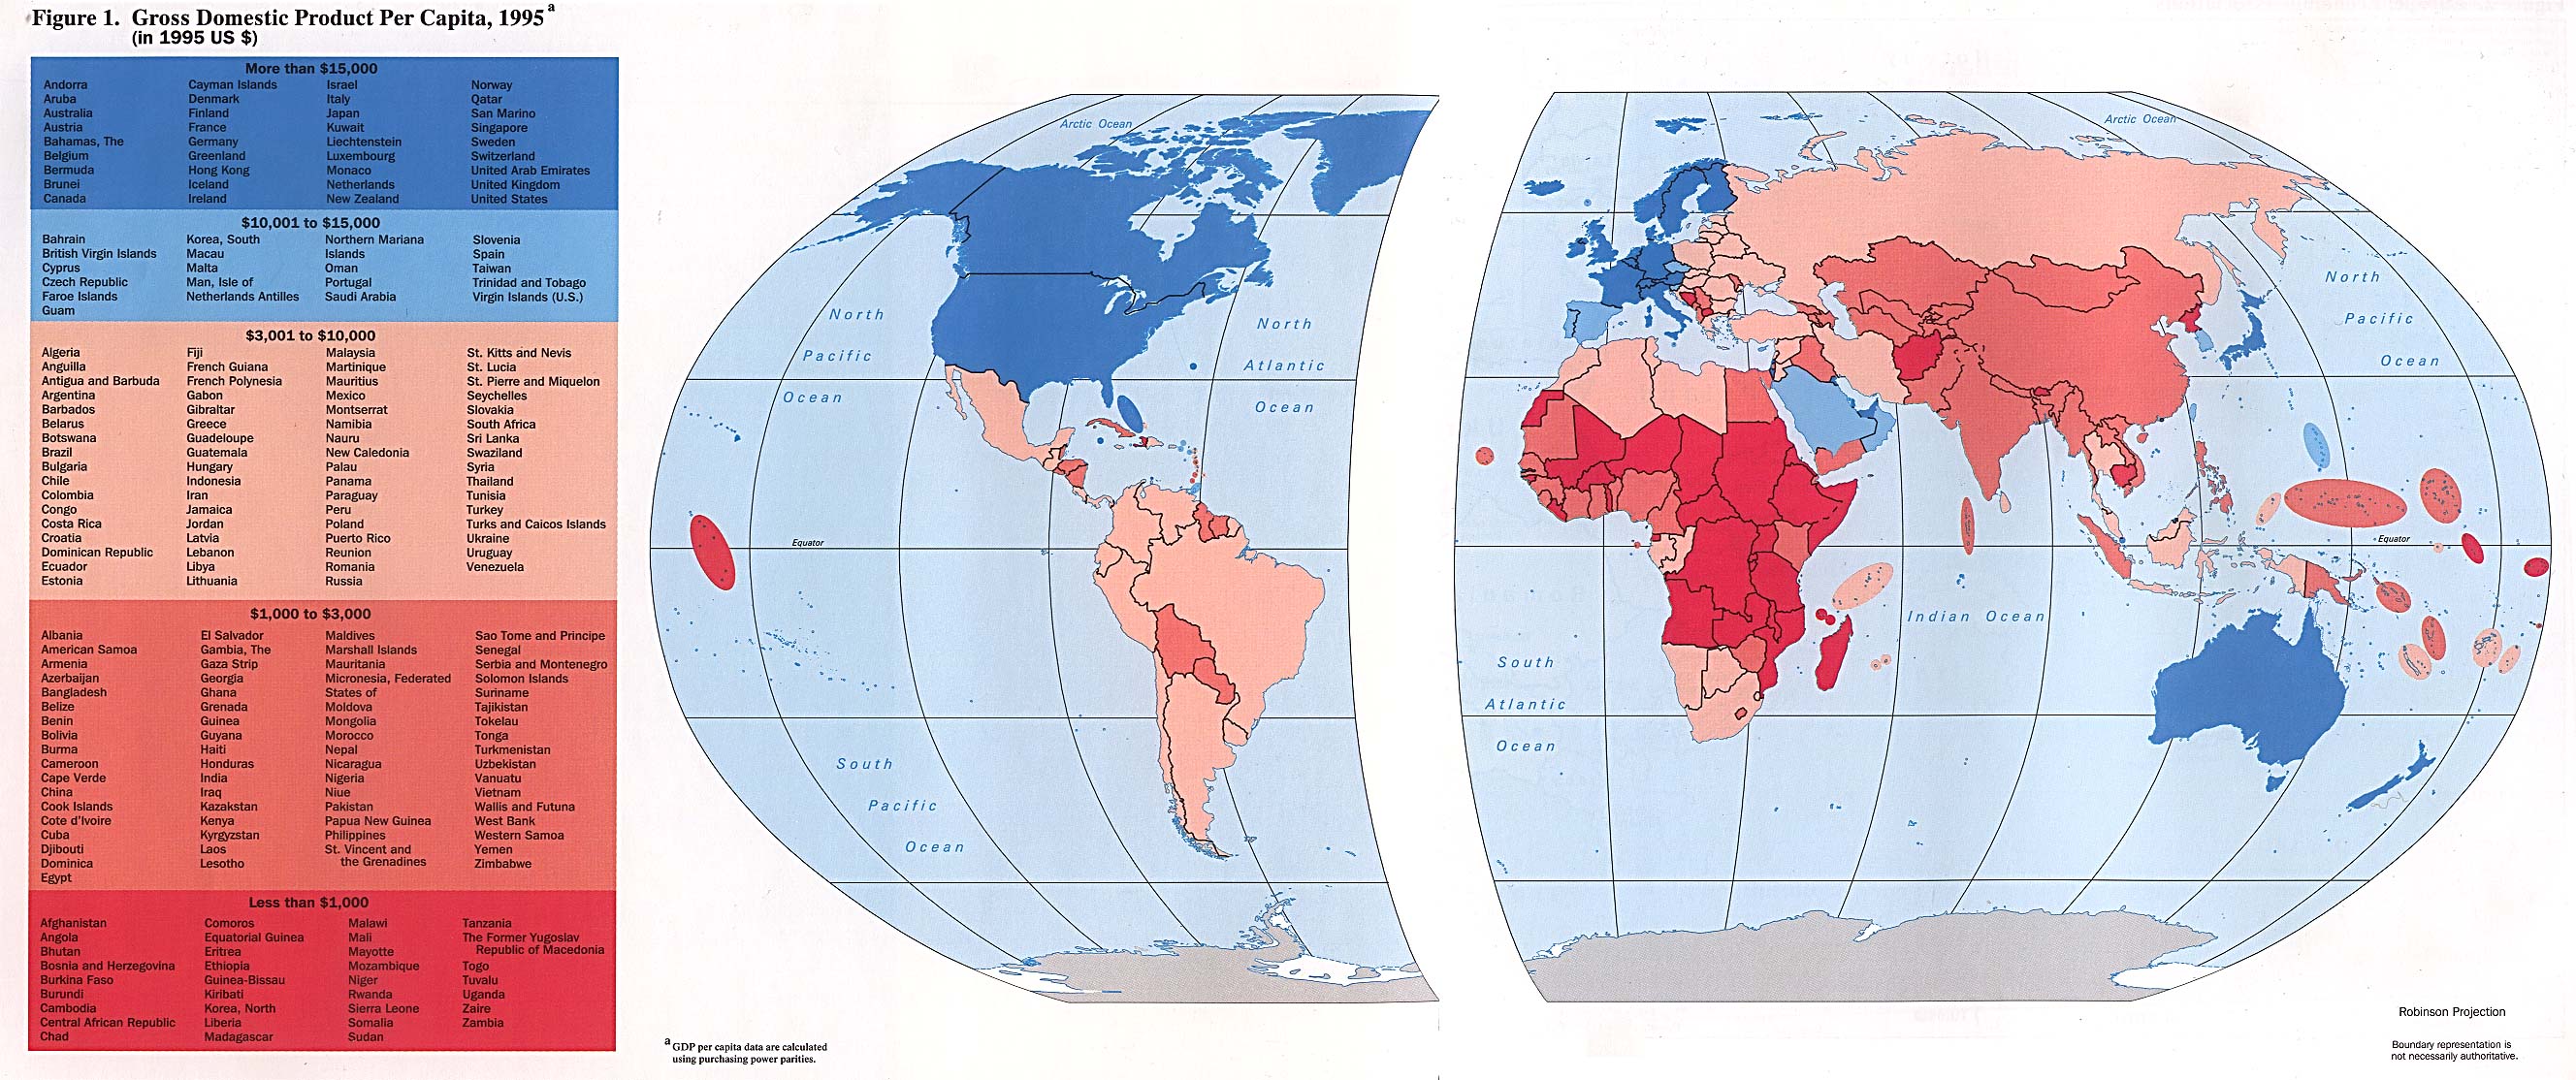
- World - Gross Domestic Product Per Capita from Handbook of International Economic Statistics. 1996 (546K)
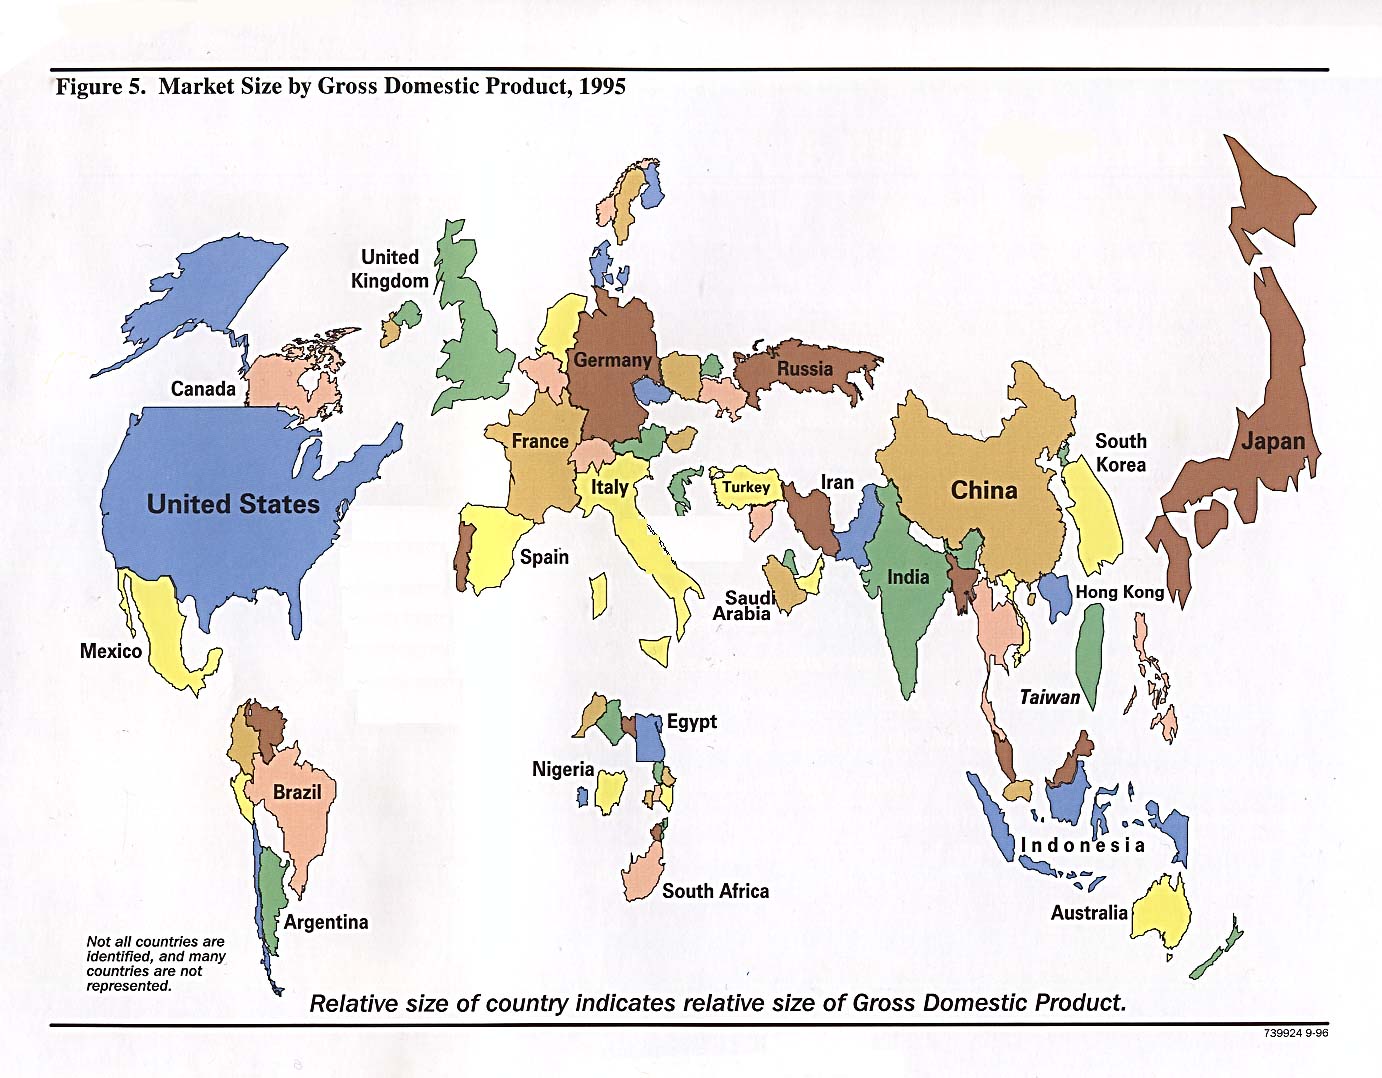
- World - Market Size By Gross Domestic Product from Handbook of International Economic Statistics. 1996 (215K)
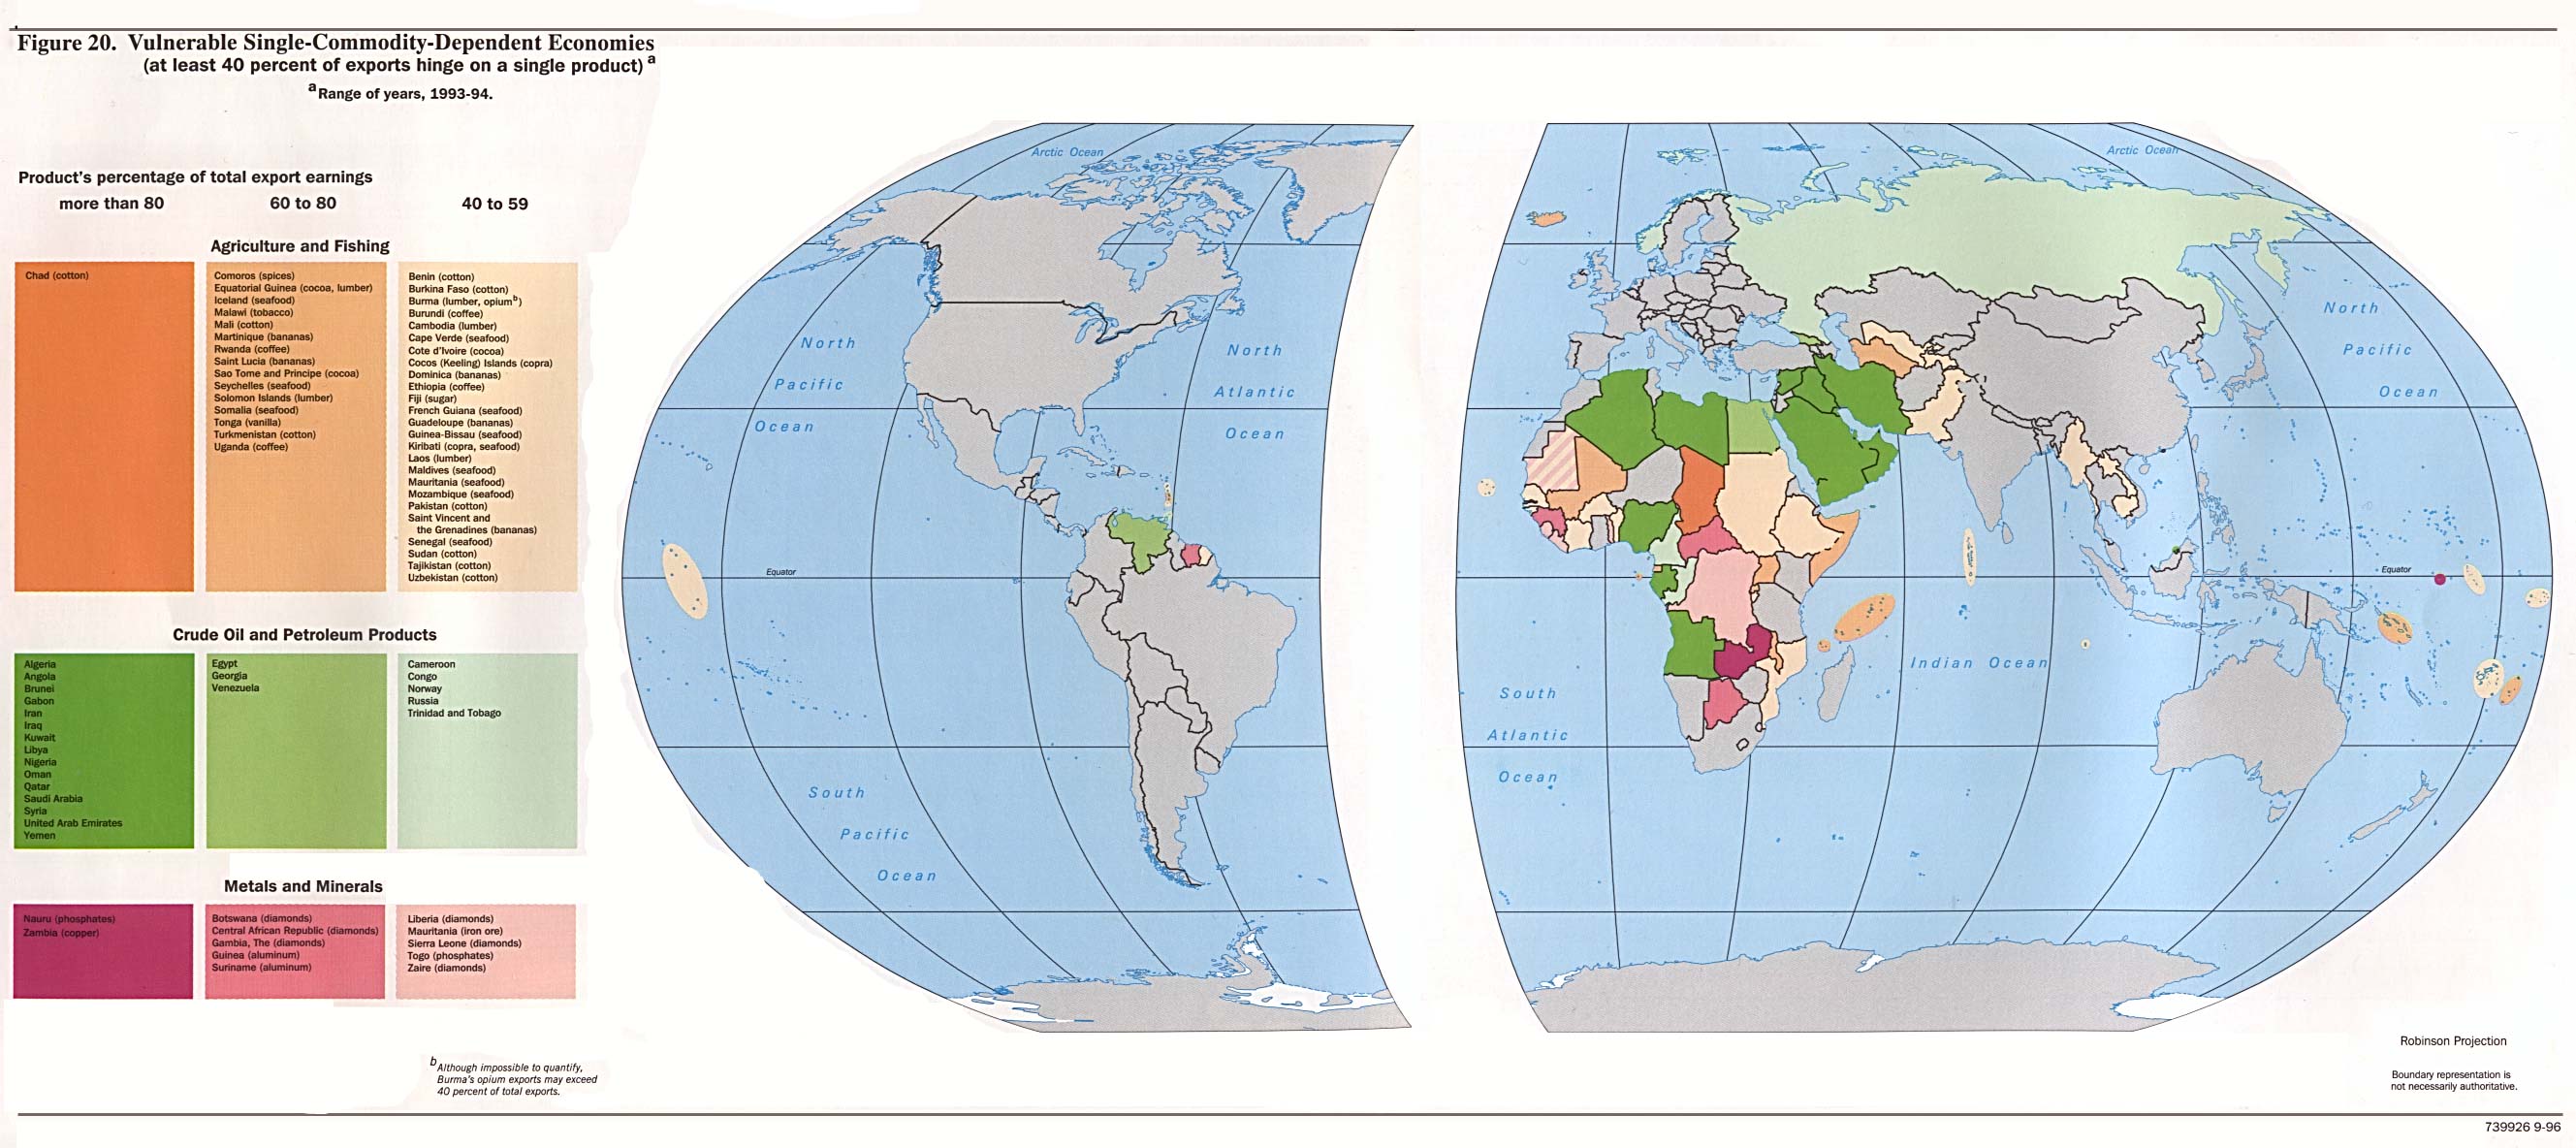
- World - Vulnerable Single-Commoditiy-Dependent Economies from Handbook of International Economic Statistics 1996 (390K)
- Yemen - Economic Activity from the CIA Atlas of the Middle East 1993 (81K)
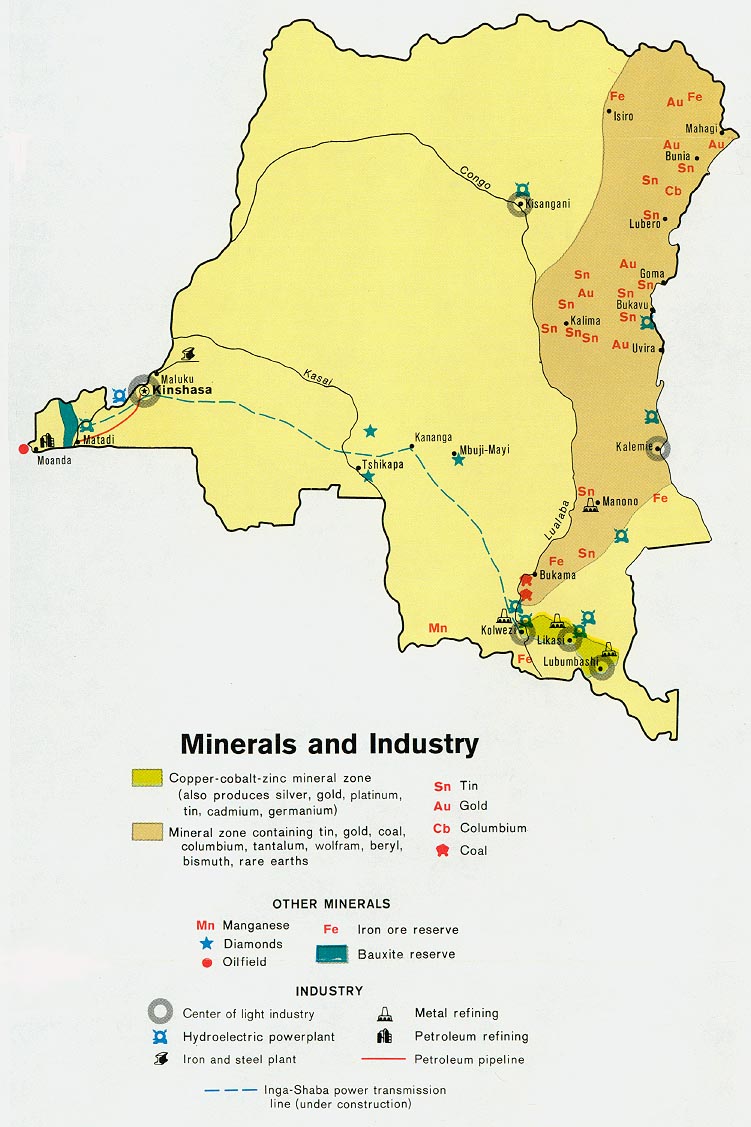
- Zaire - Minerals and Industry from Map No. 504165 1979 (141K)
- [Zimbabwe] Rhodesia - Economic Activity from Map No. 543857 1979 (174K)
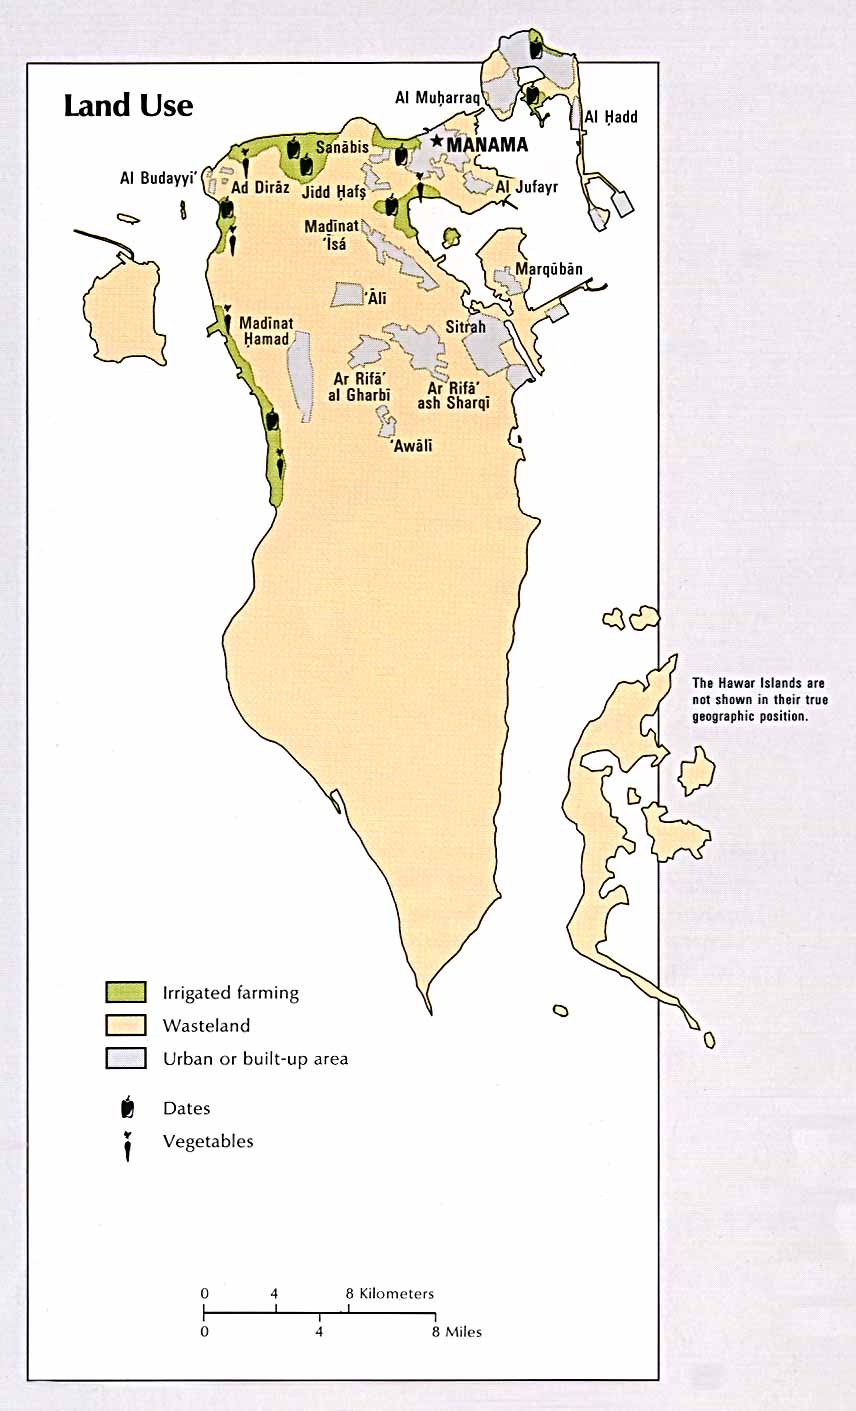
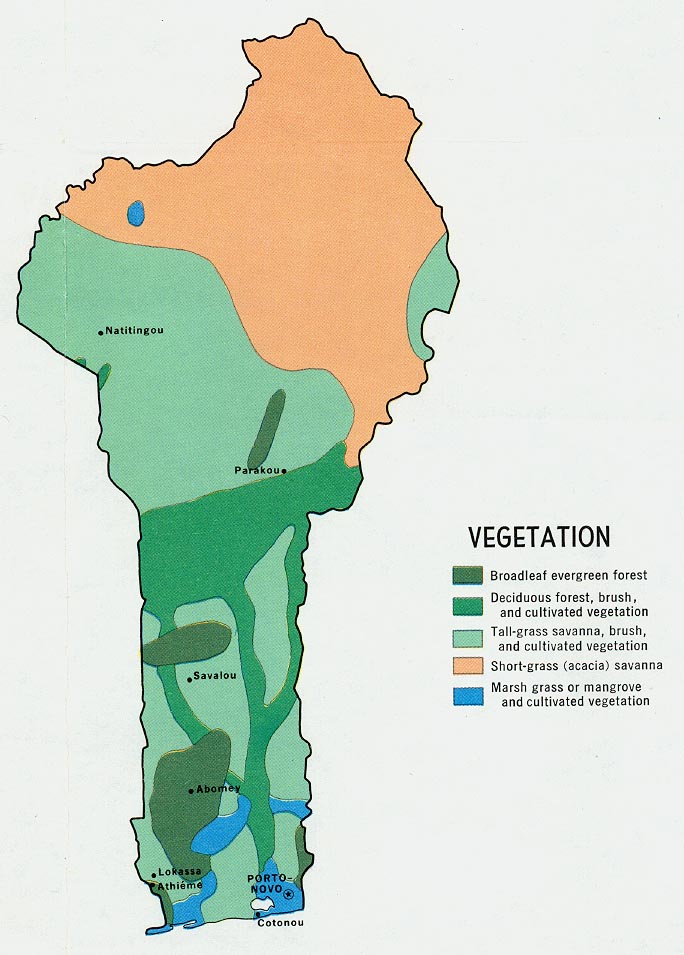
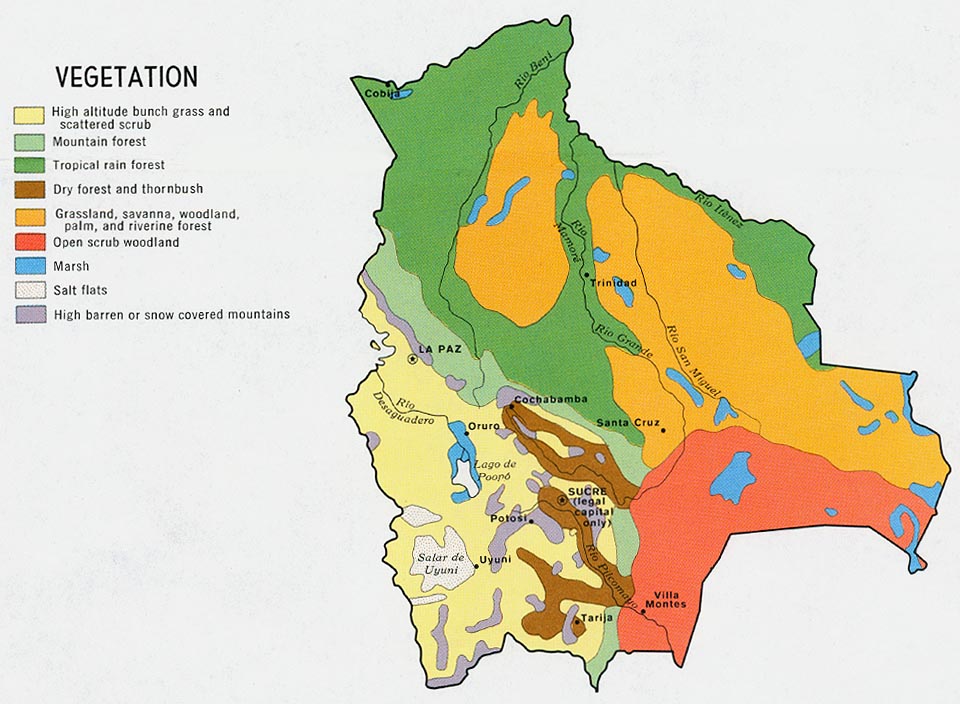
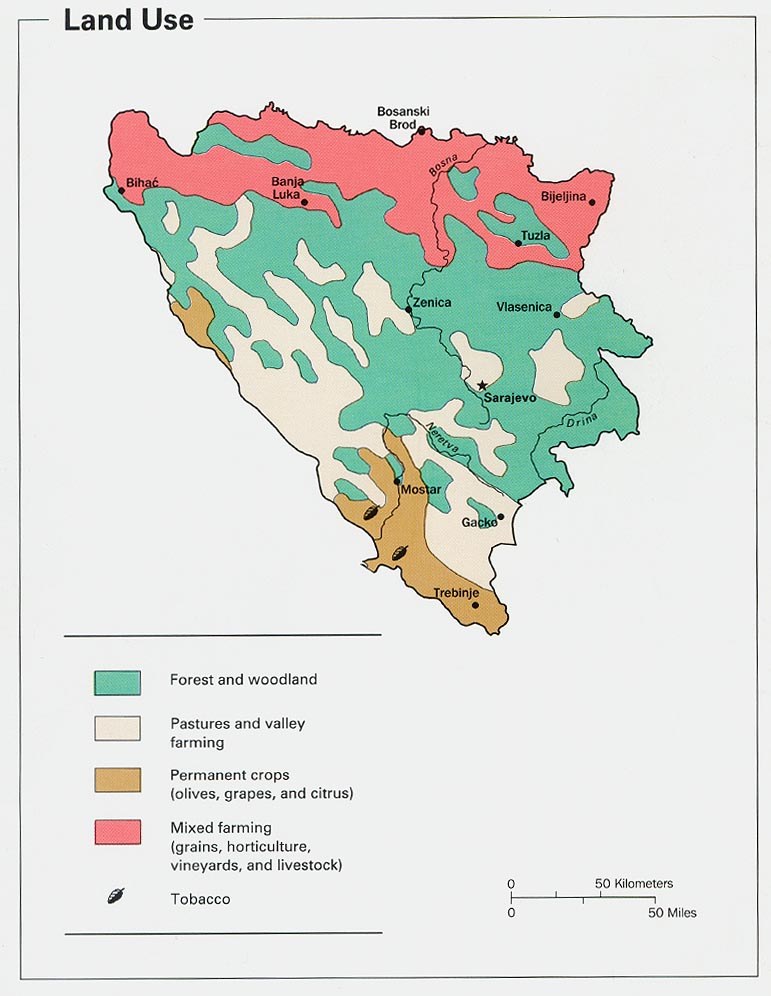
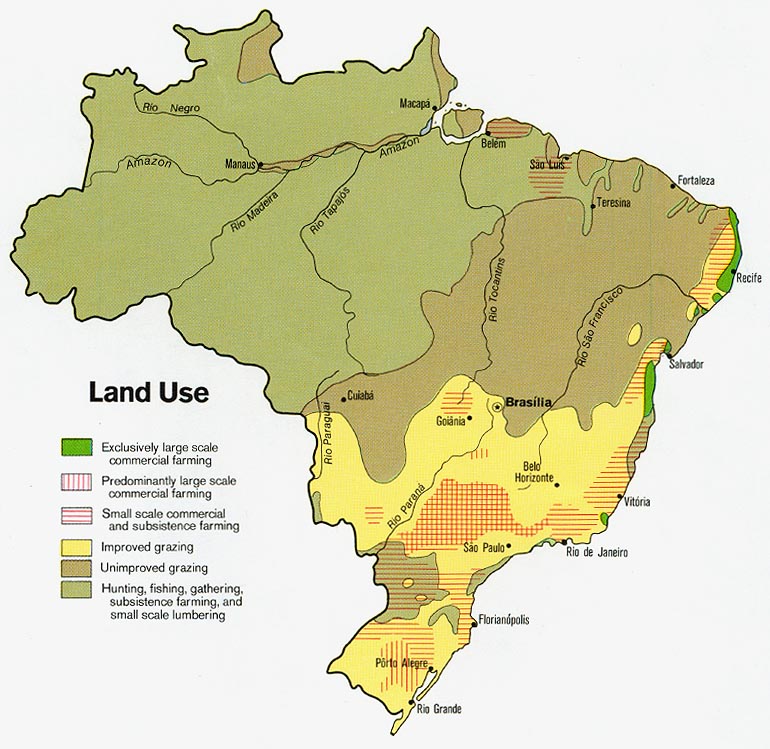
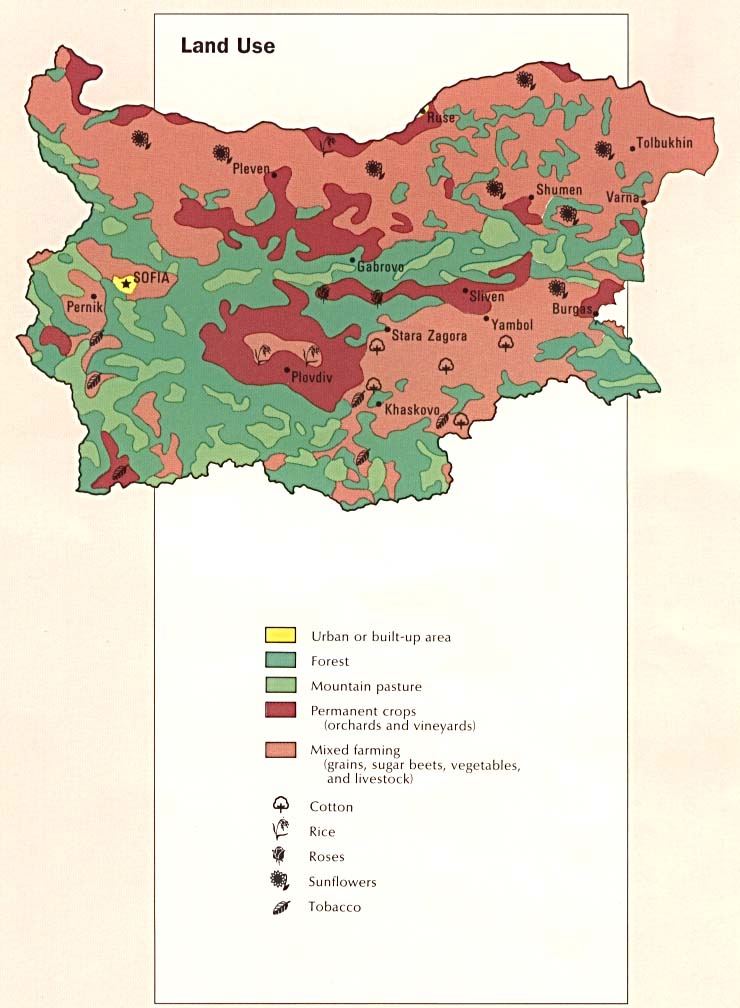
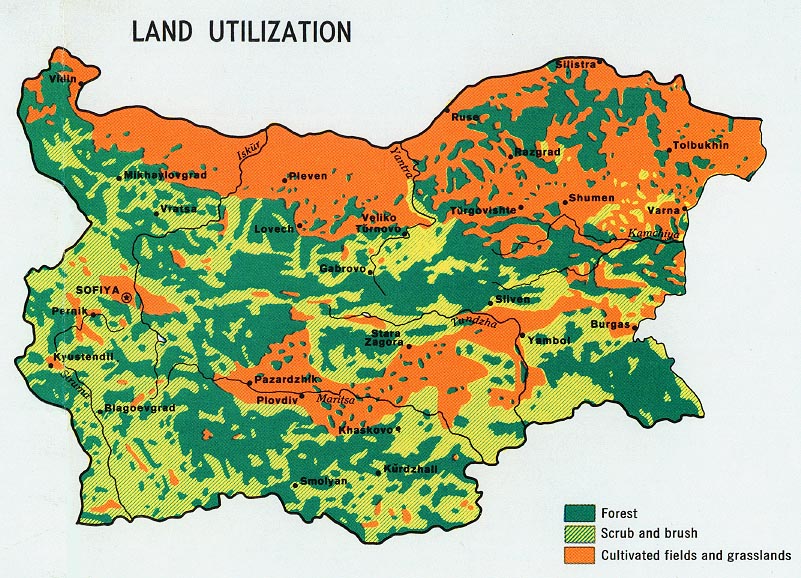
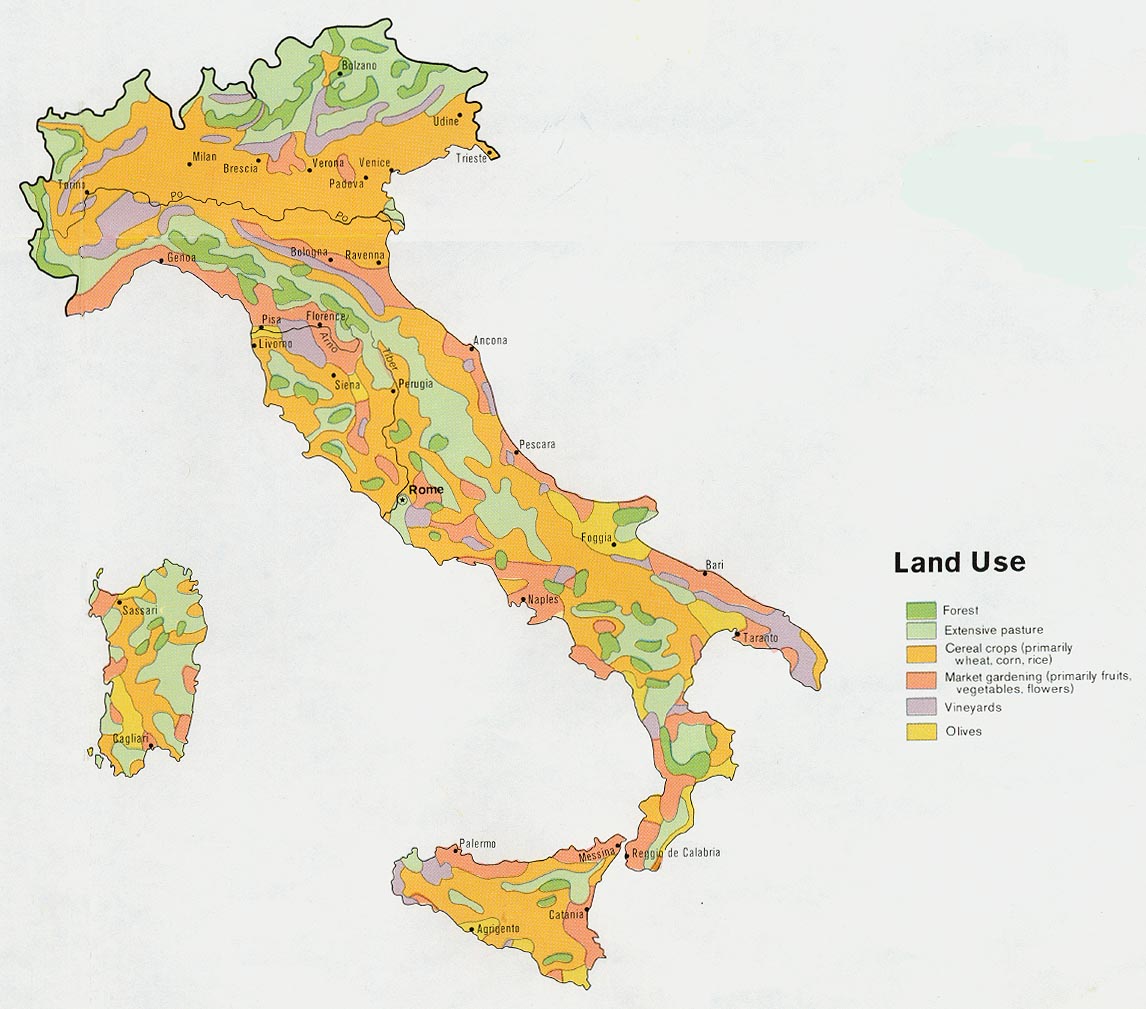
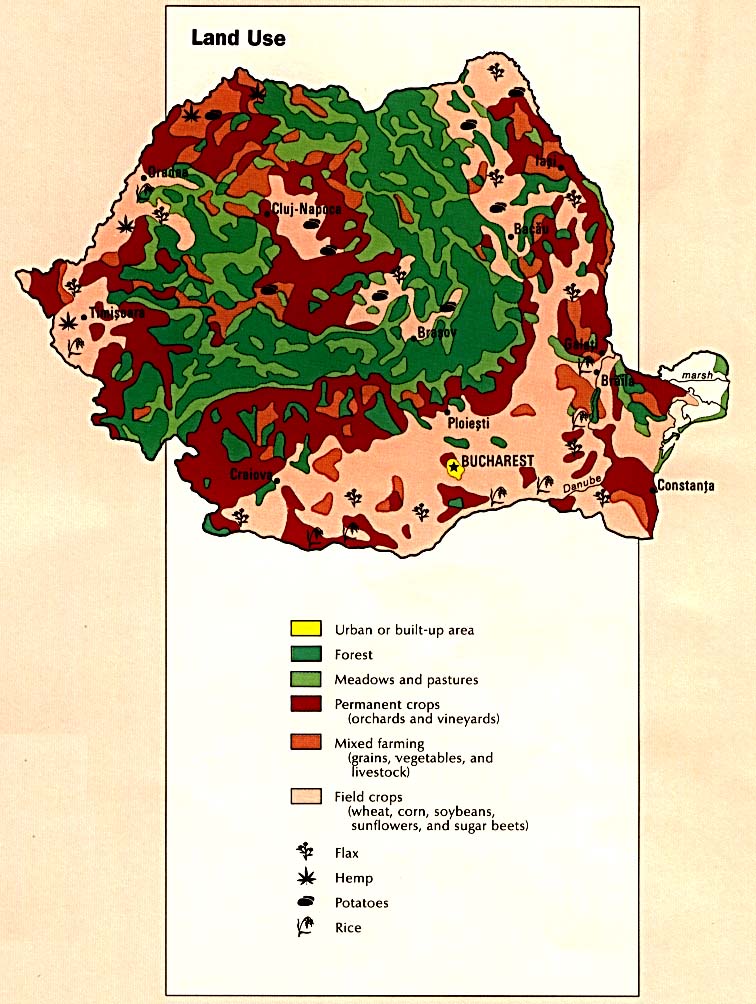
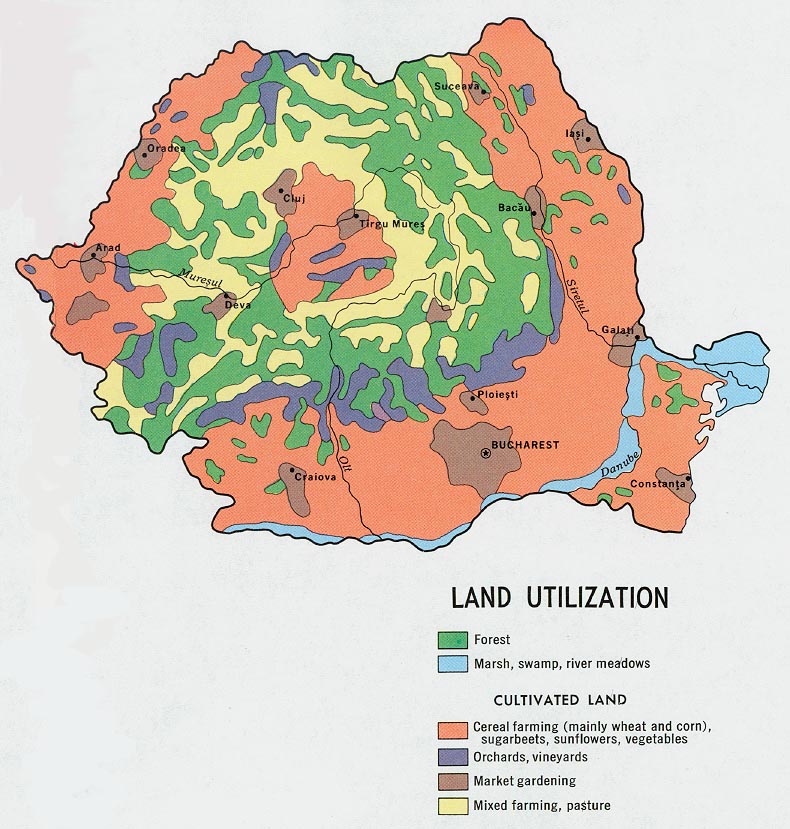
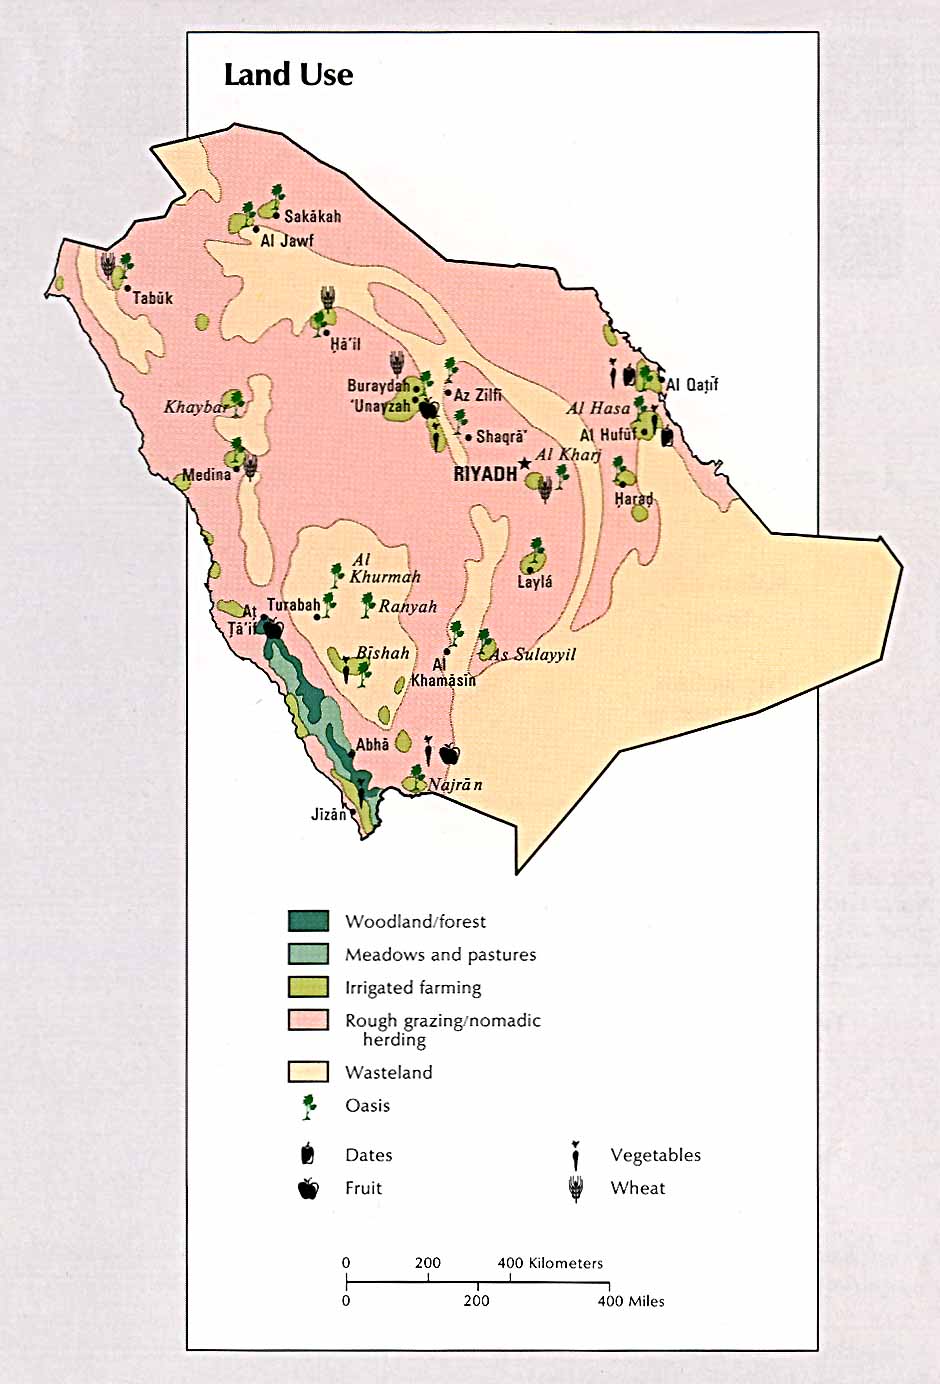
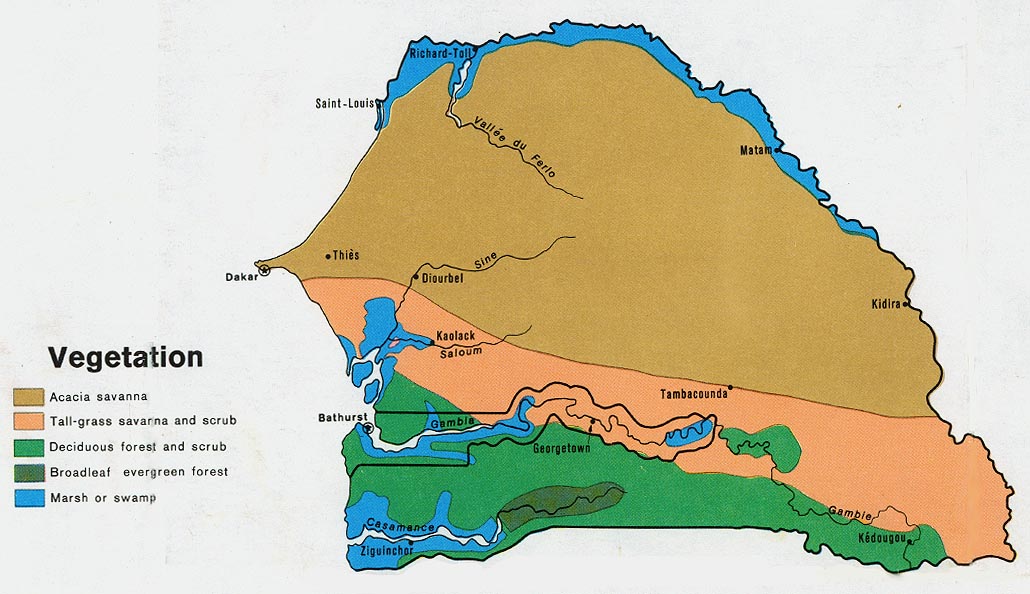
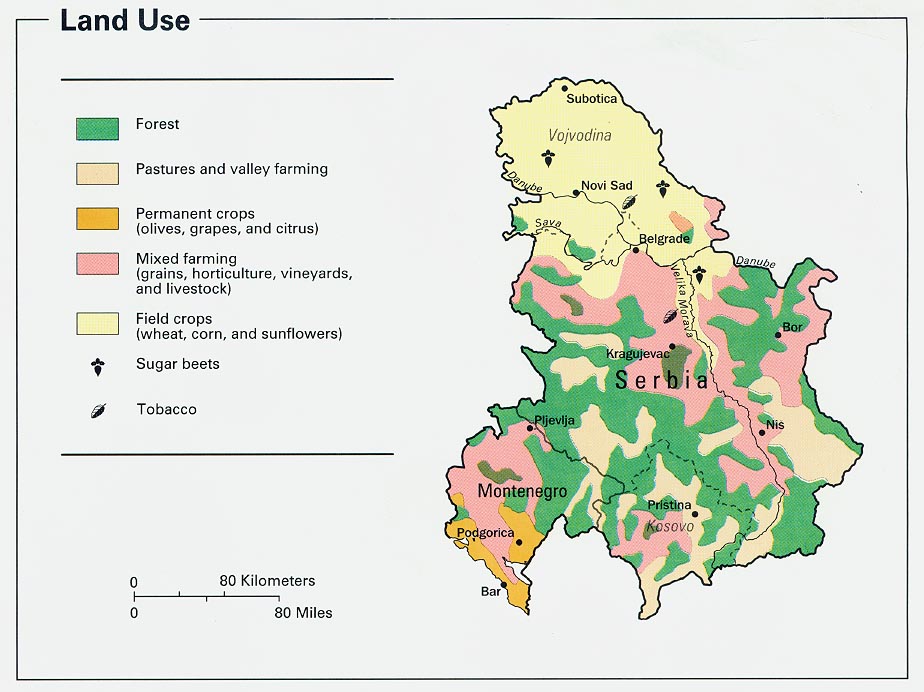
Land Use
Military
Population
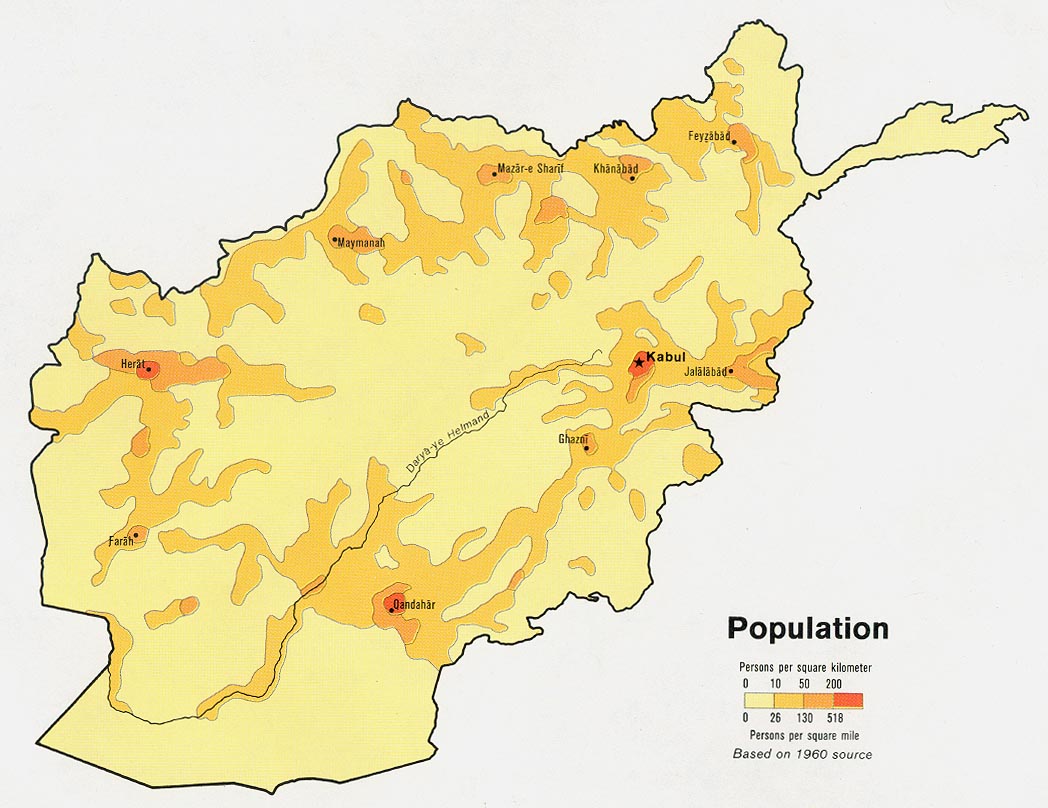
- Afghanistan - Population from Map No. 504958 1971 (145K)
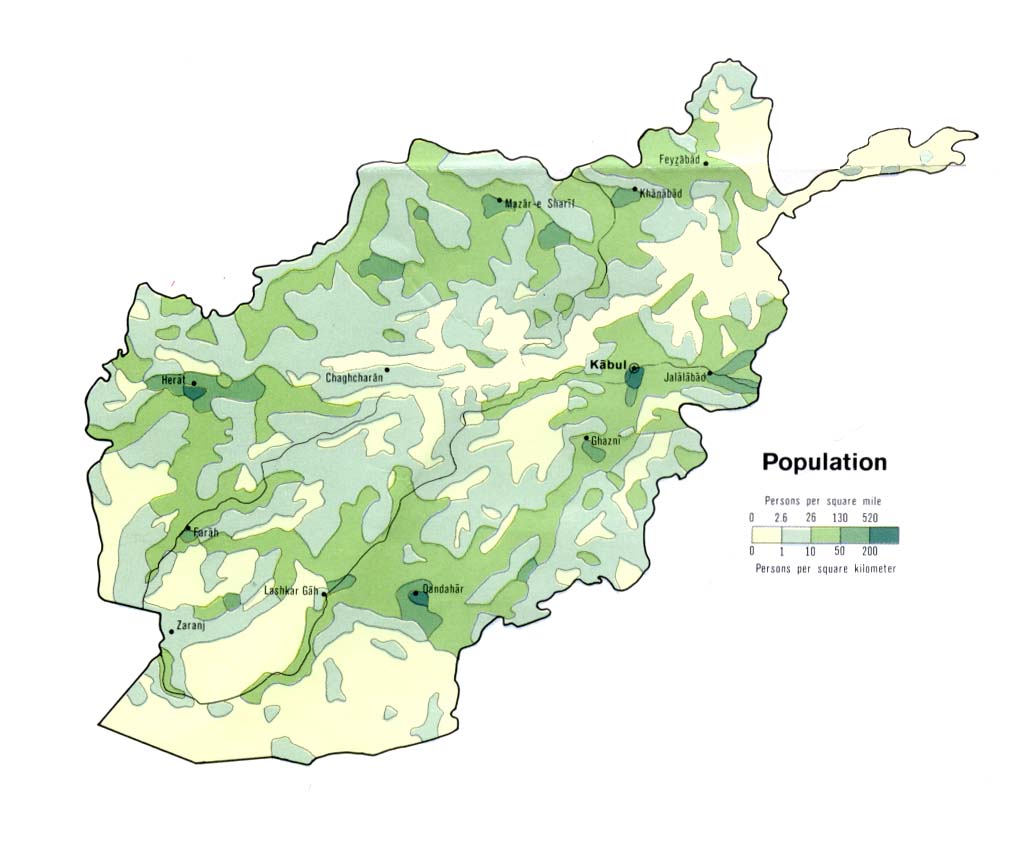
- Afghanistan - Population 1972 (73K)
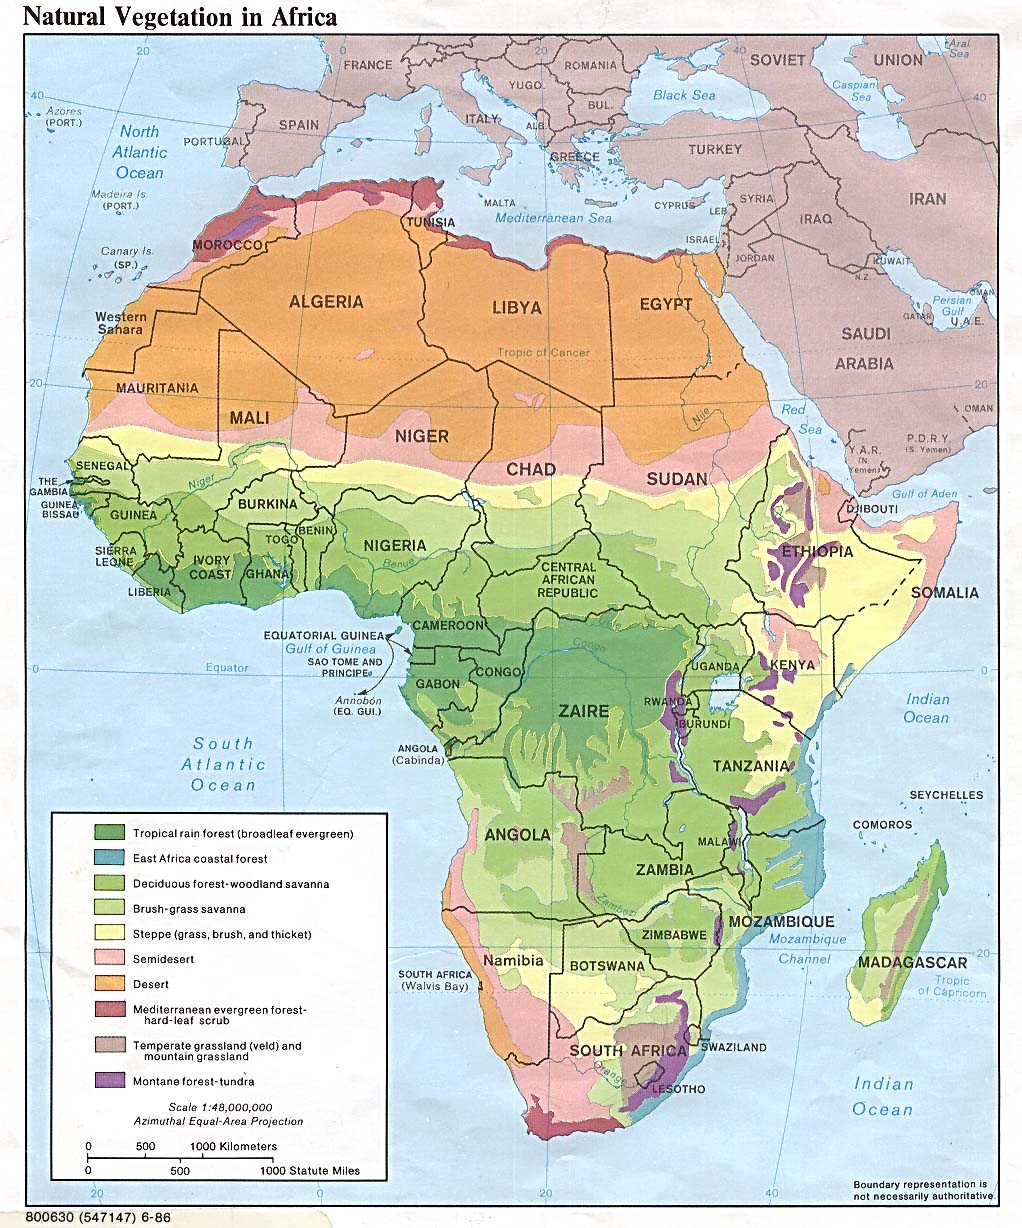
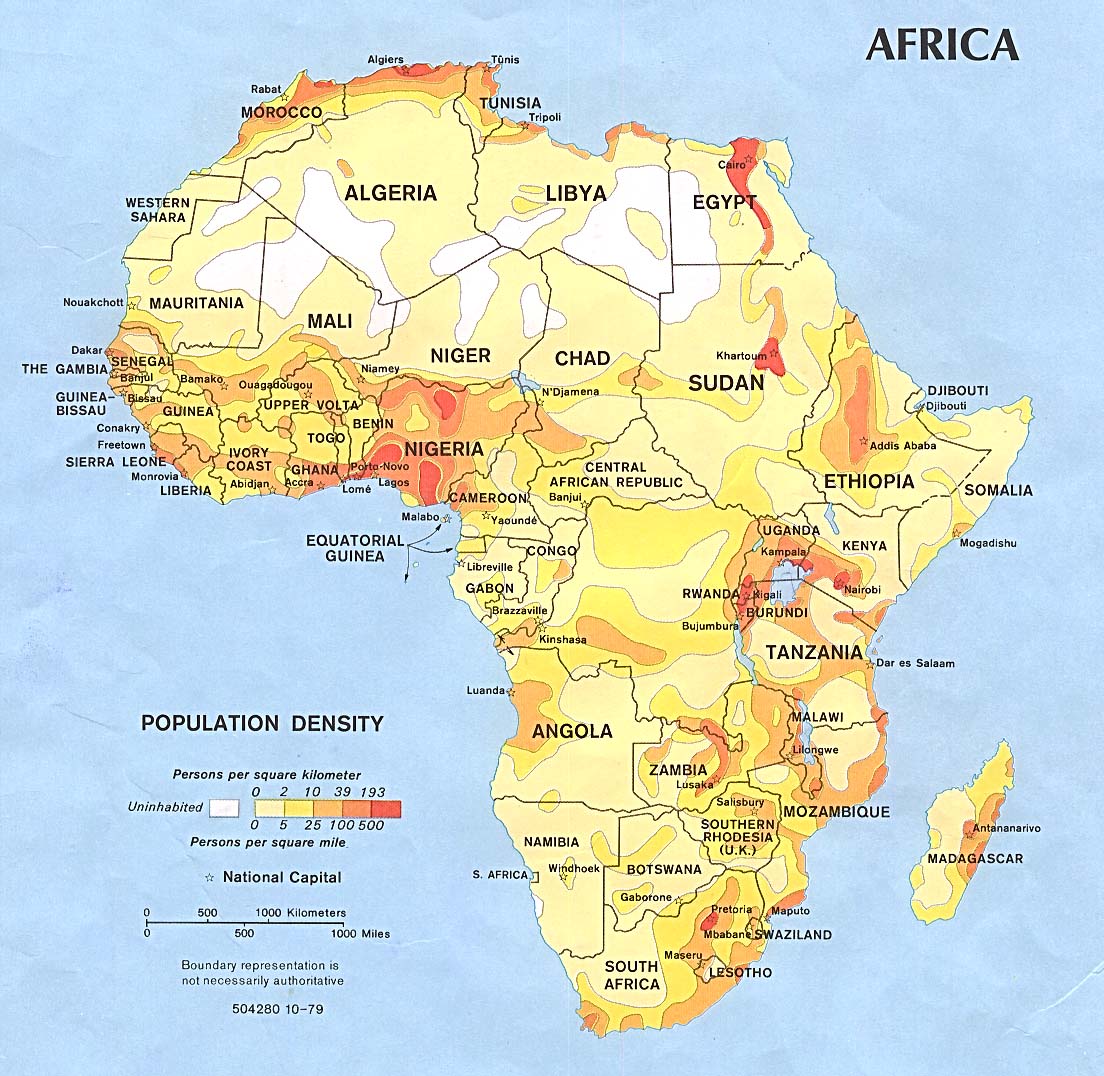
- Africa - Population Density 1979 (232K) and pdf format (235K)
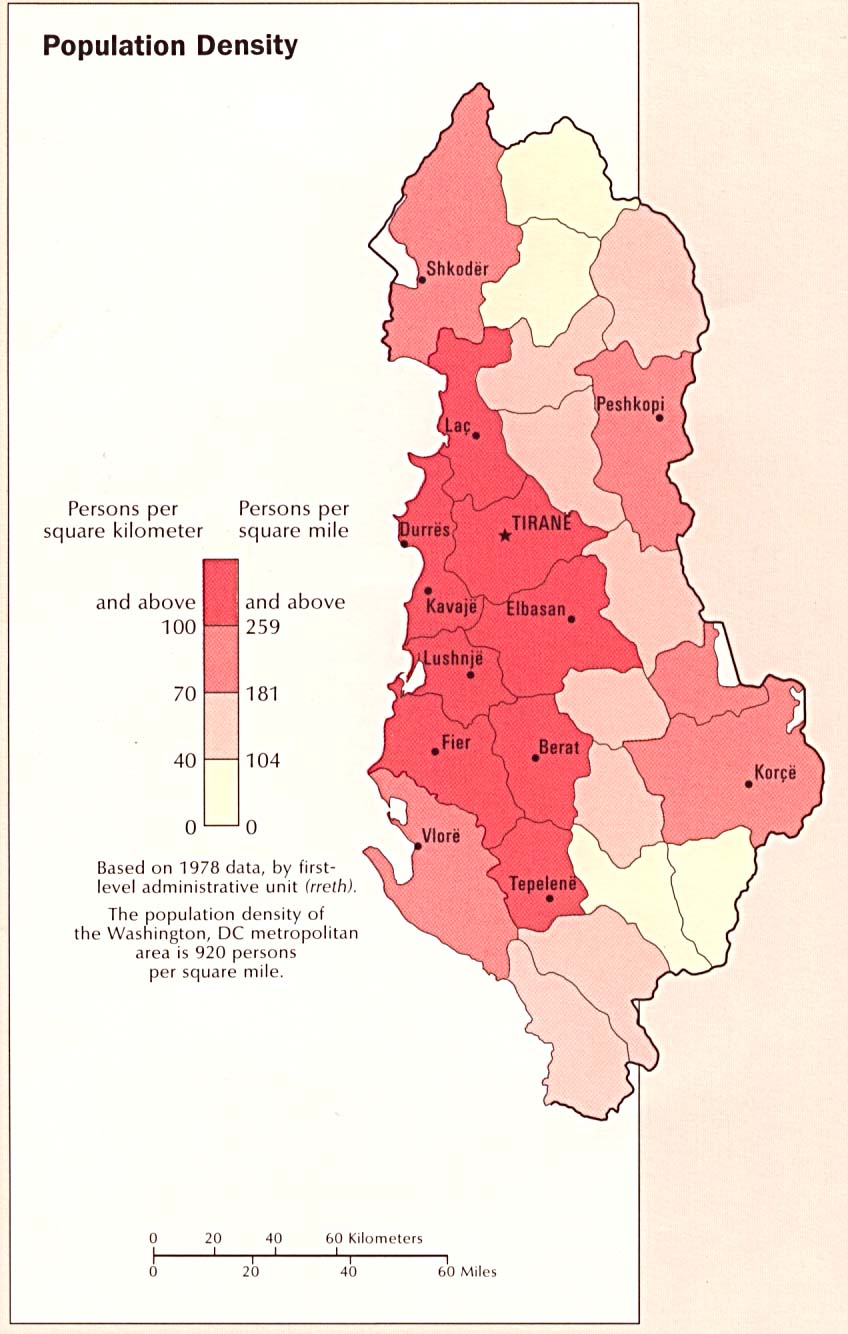
- Albania - Population Density from CIA Atlas of Eastern Europe 1990 (117K)
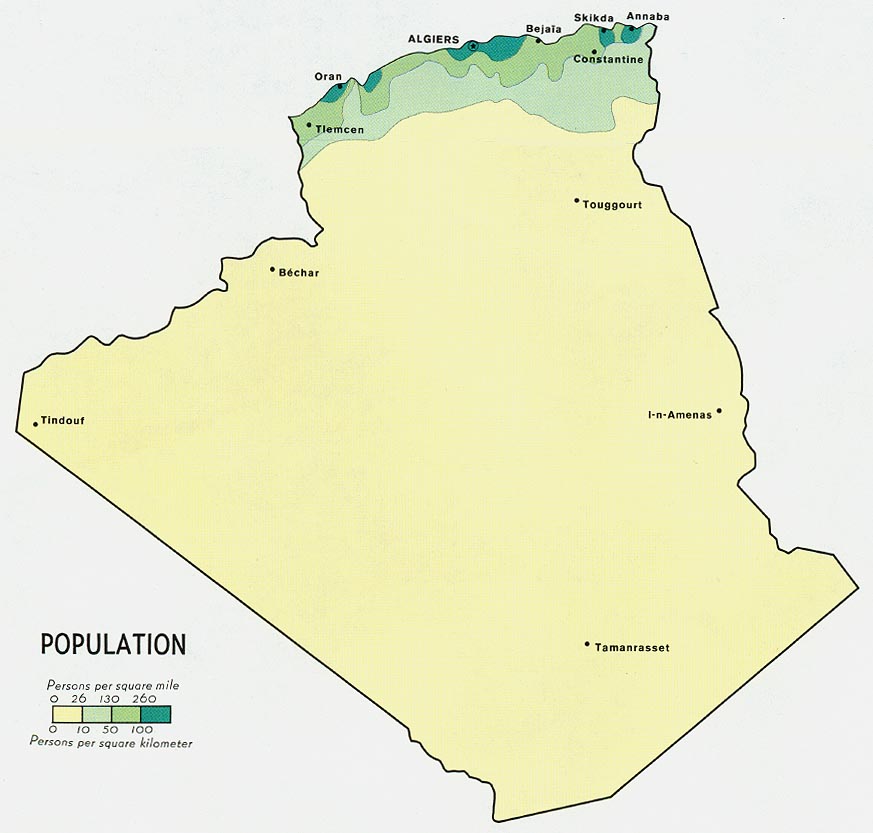
- Algeria - Population from Map No. 78692 1971 (82K)
- Angola - Population from Map No. 77961 1973 (94K)
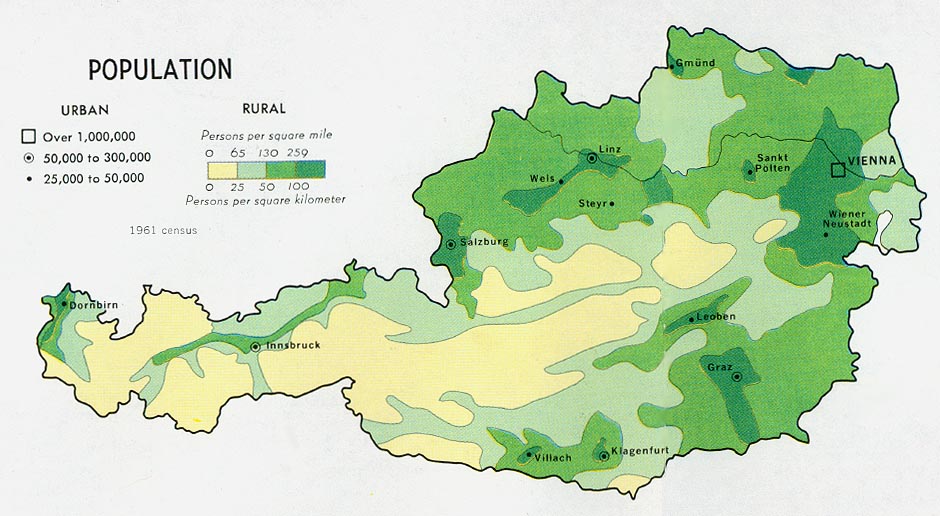
- Austria - Population from Map No. 77706 1969 (120K)
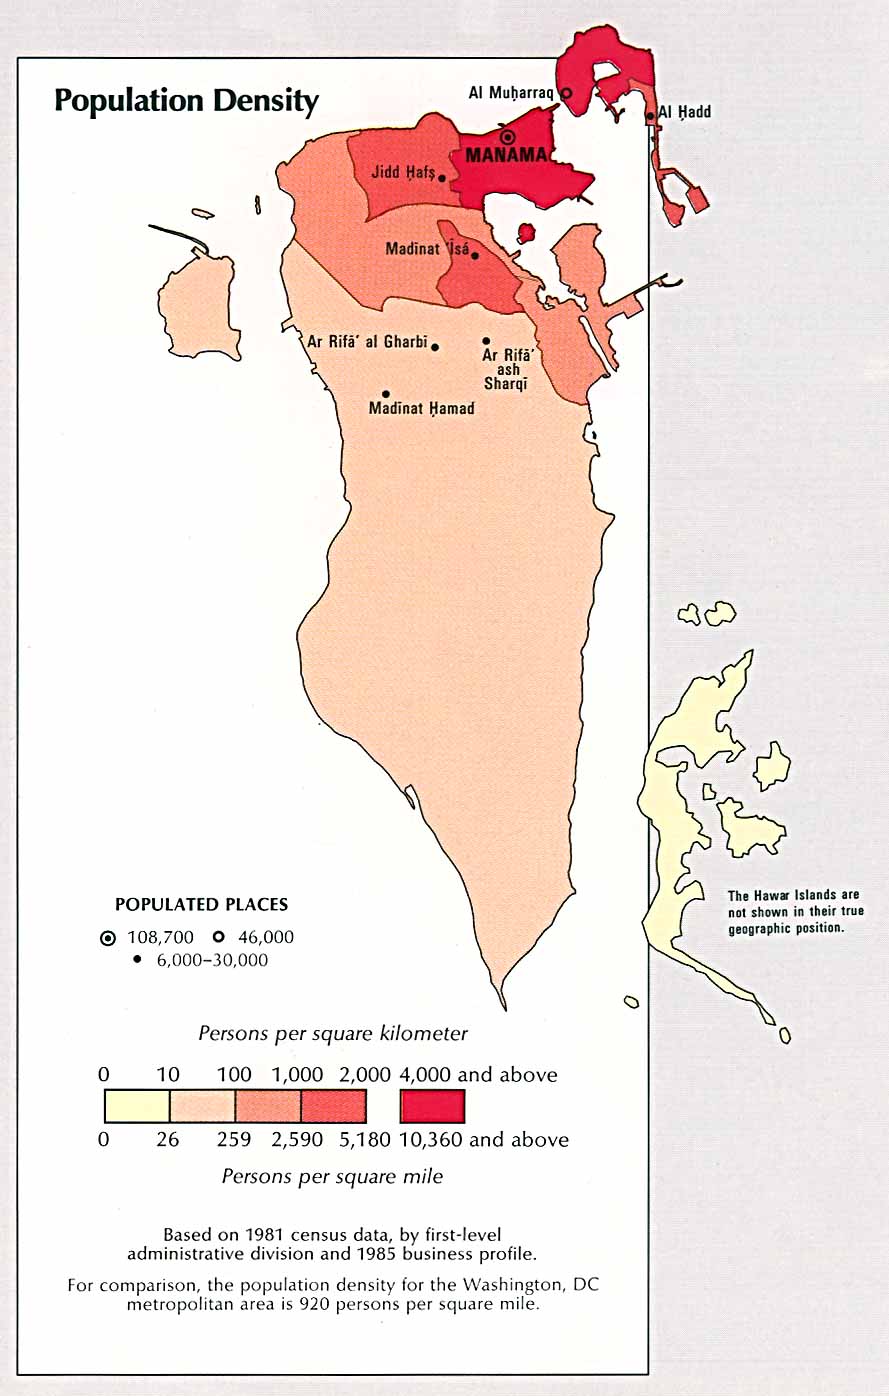
- Bahrain - Population Density from the CIA Atlas of the Middle East 1993 (110K)
- Belgium - Population from Map No. 75519 1968 (90K)
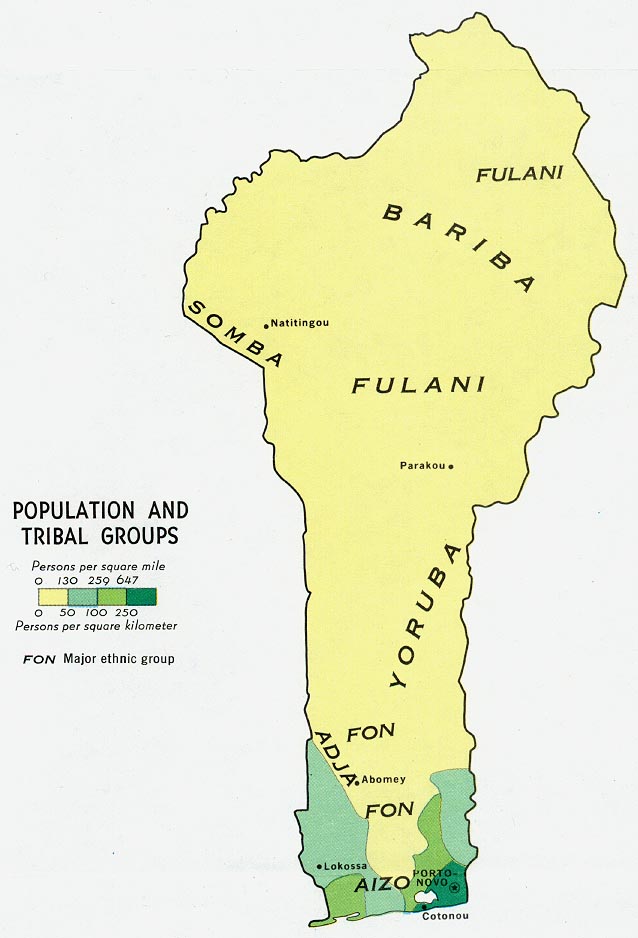
- Benin - Population and Tribal Groups from Map No. 77258 1970 (81K)
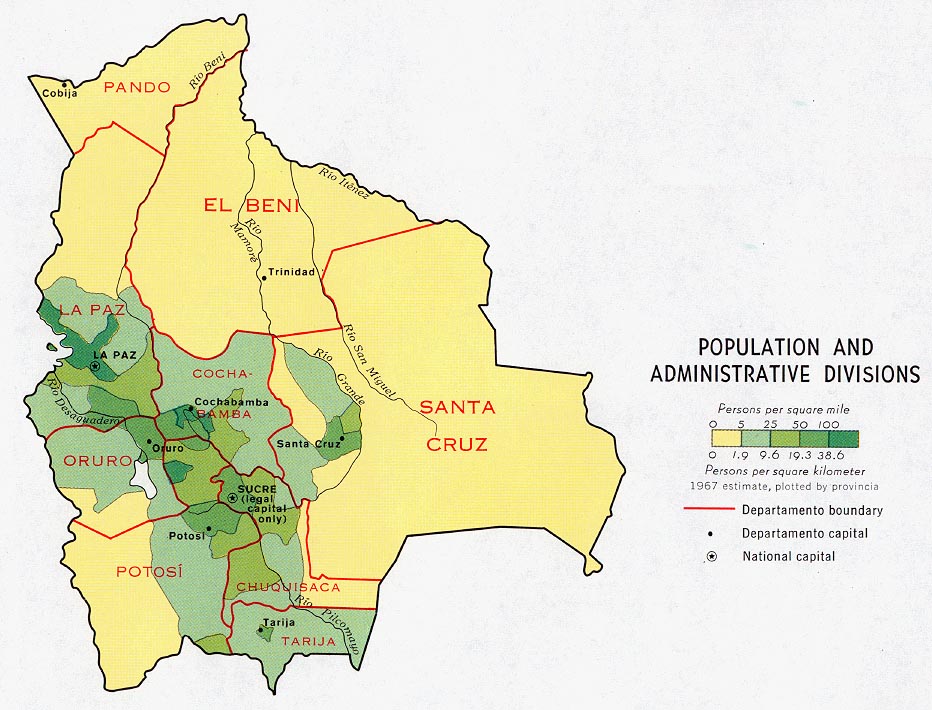
- Bolivia - Population and Administrative Divisions from Map No. 78499 1971 (149K)
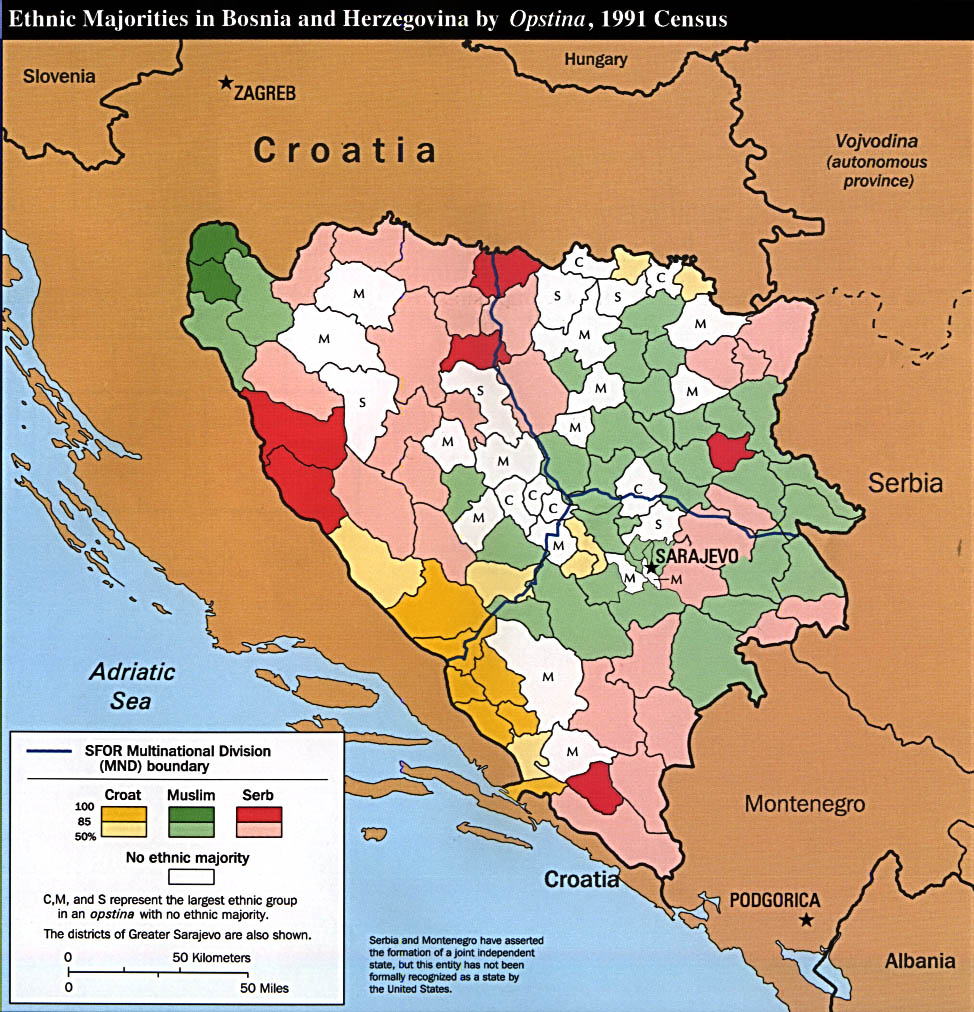
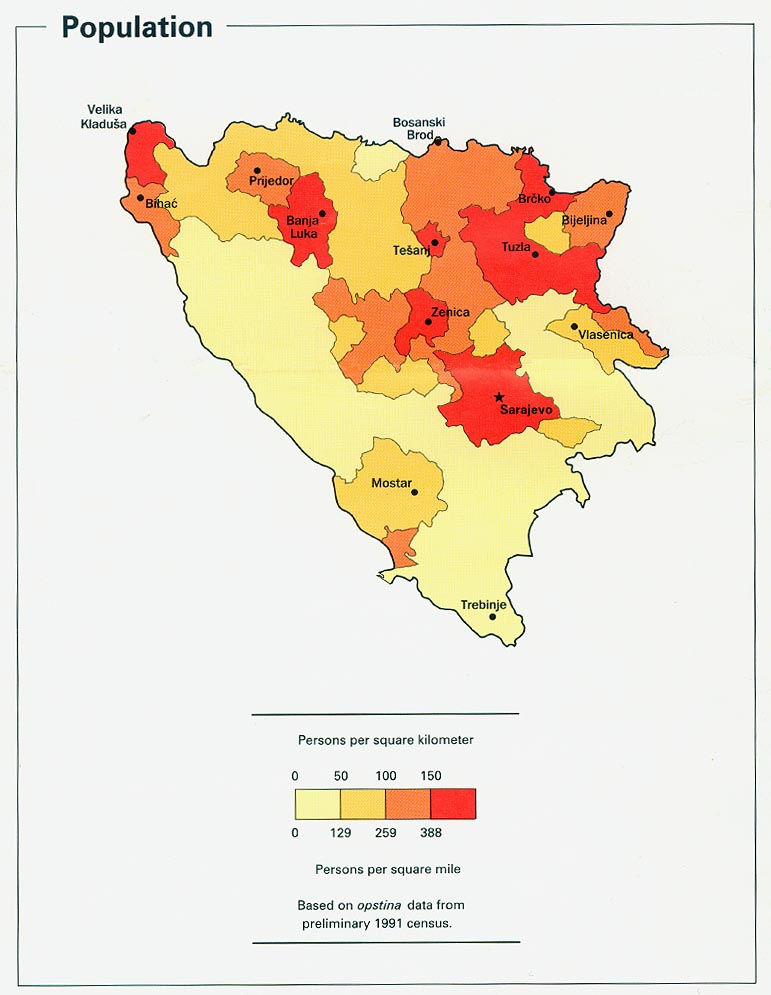
- Bosnia and Herzegovina - Population from Map No. 802172 1993 (121K)
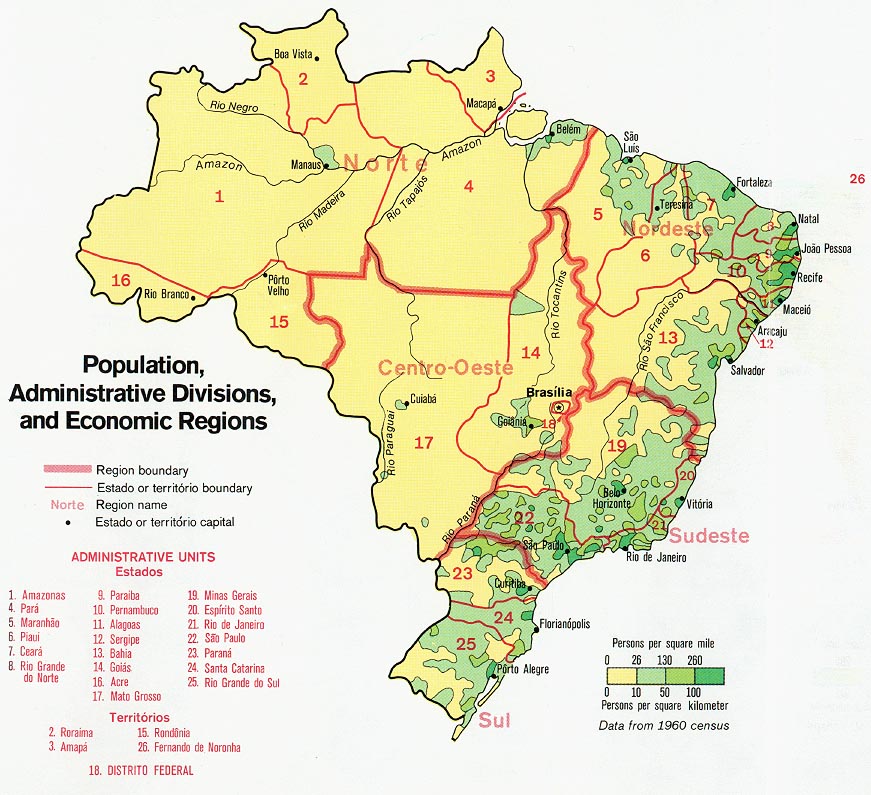
- Brazil - Population, Administrative Divisions and Economic Regions from Map No. 503241 1977 (182K)
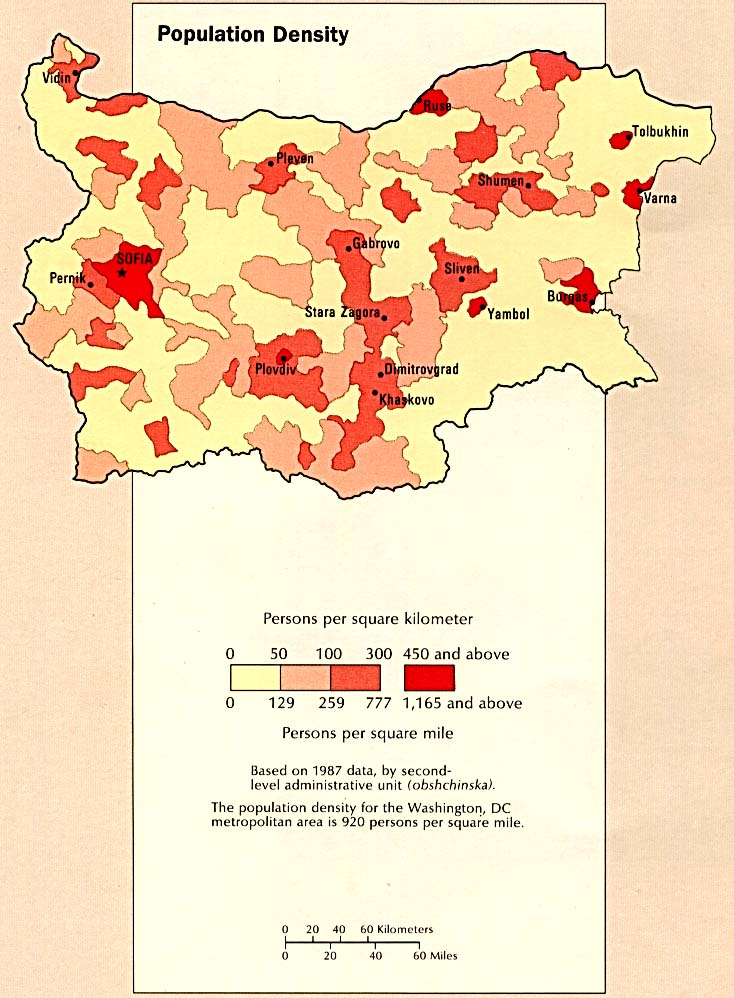
- Bulgaria - Population Density from the CIA Atlas of the Eastern Europe 1990 (115K)
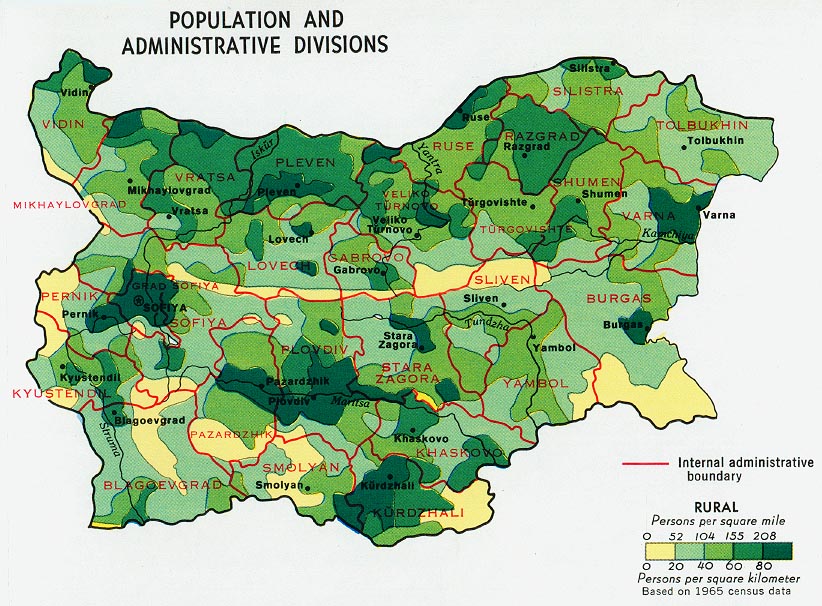
- Bulgaria - Population and Admistrative Divisions from Map No. 500252 1972 (131K)
- [Burkina Faso] Upper Volta - Population from Map No. 58207 1968 (107K)
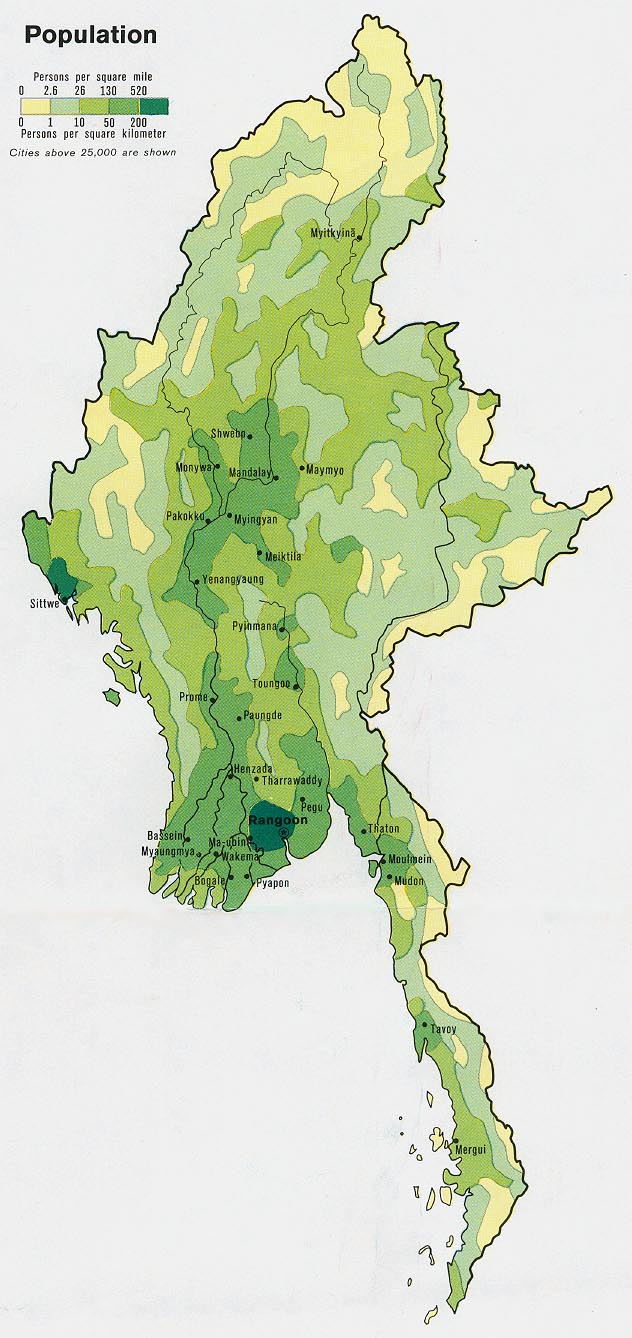
- Burma - Population from Map No. 500425 1972 (151K)
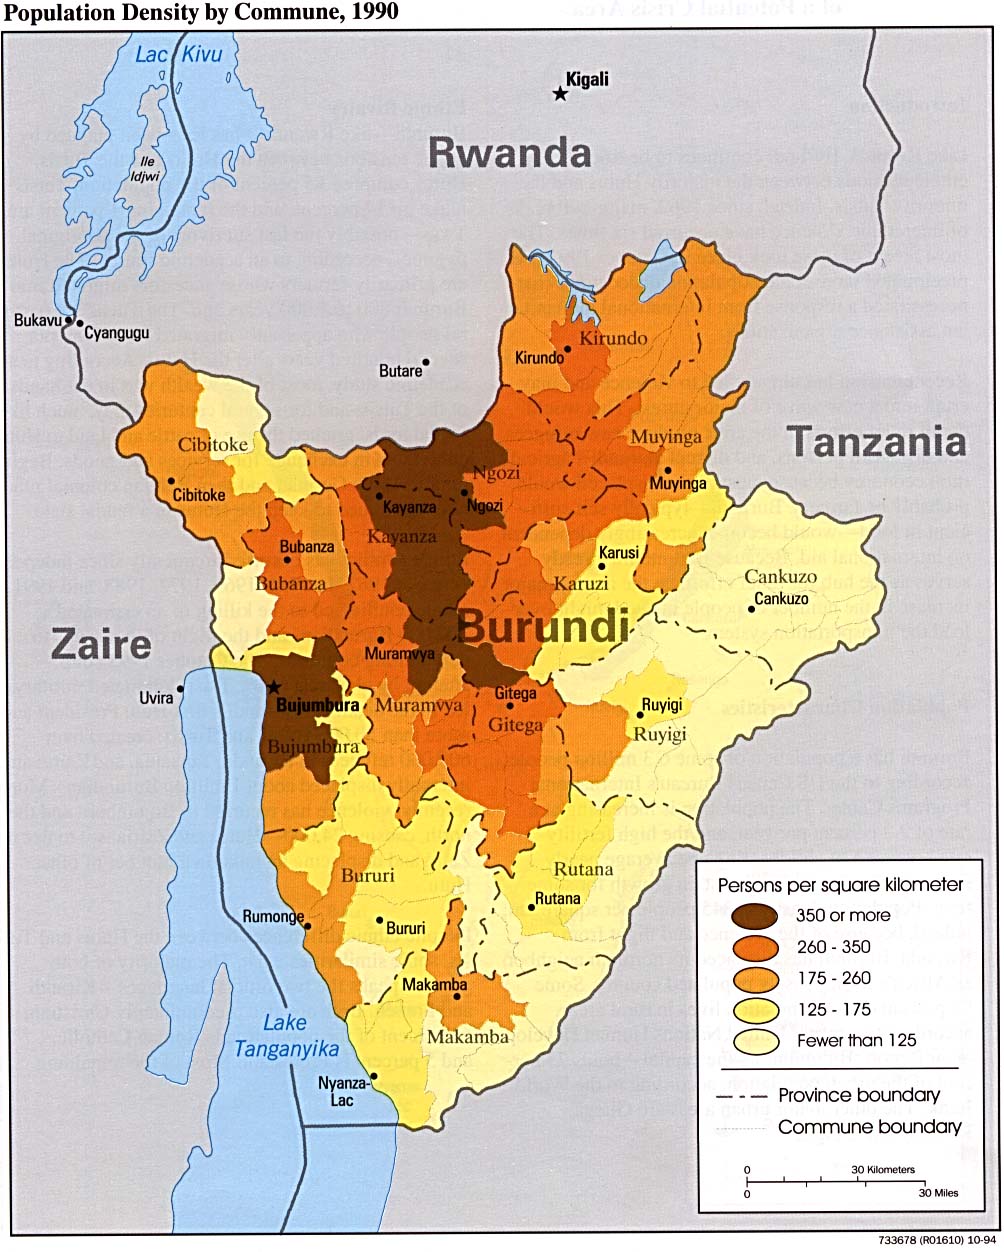
- Burundi - Population Density by Commune, 1990 1995 (195K)
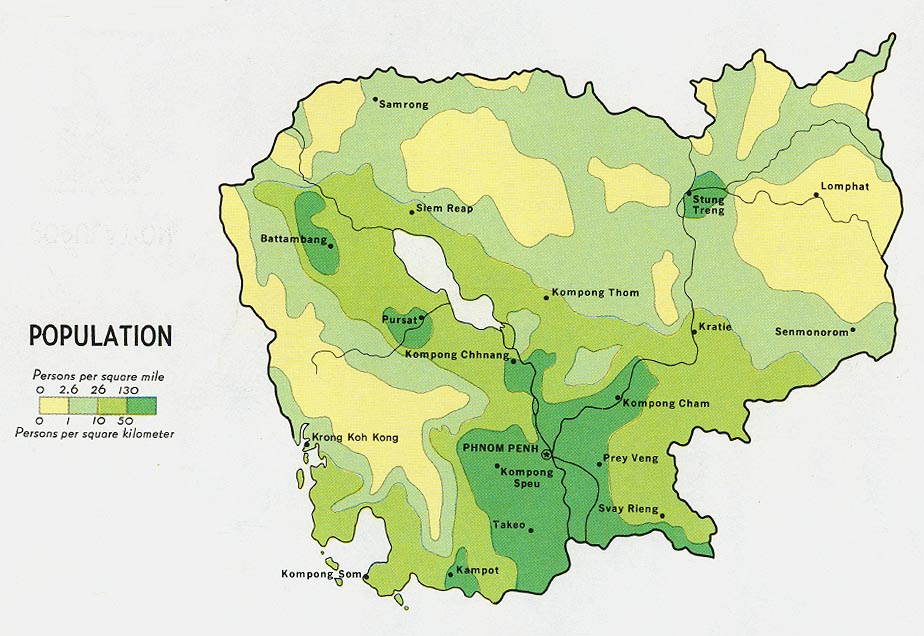
- Cambodia - Population from Map No. 77967 1972 (133K)
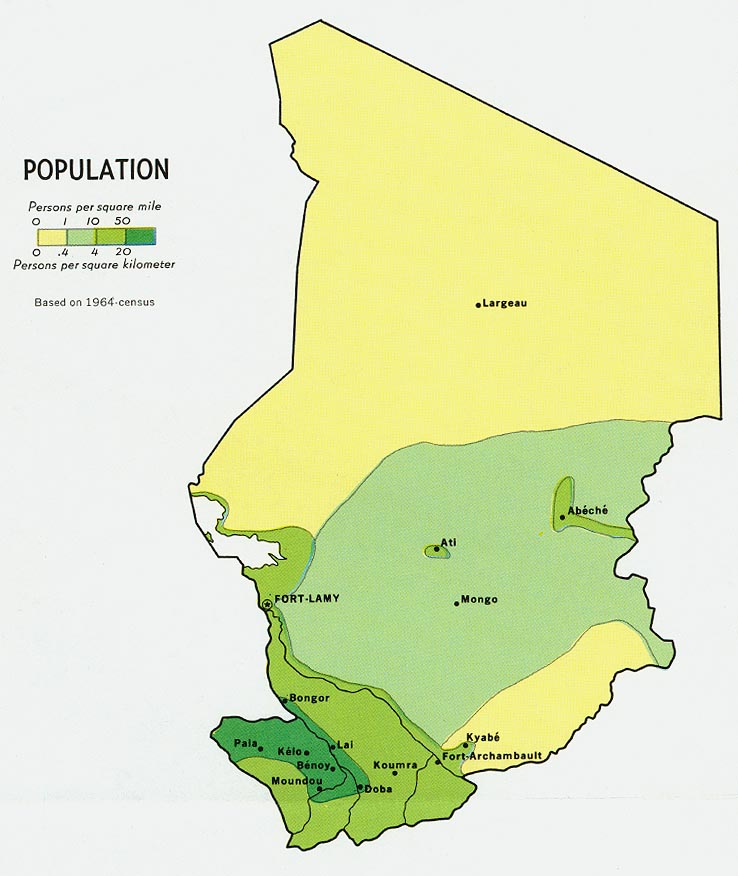
- Chad - Population from Map No. 59886 1969 (98K)
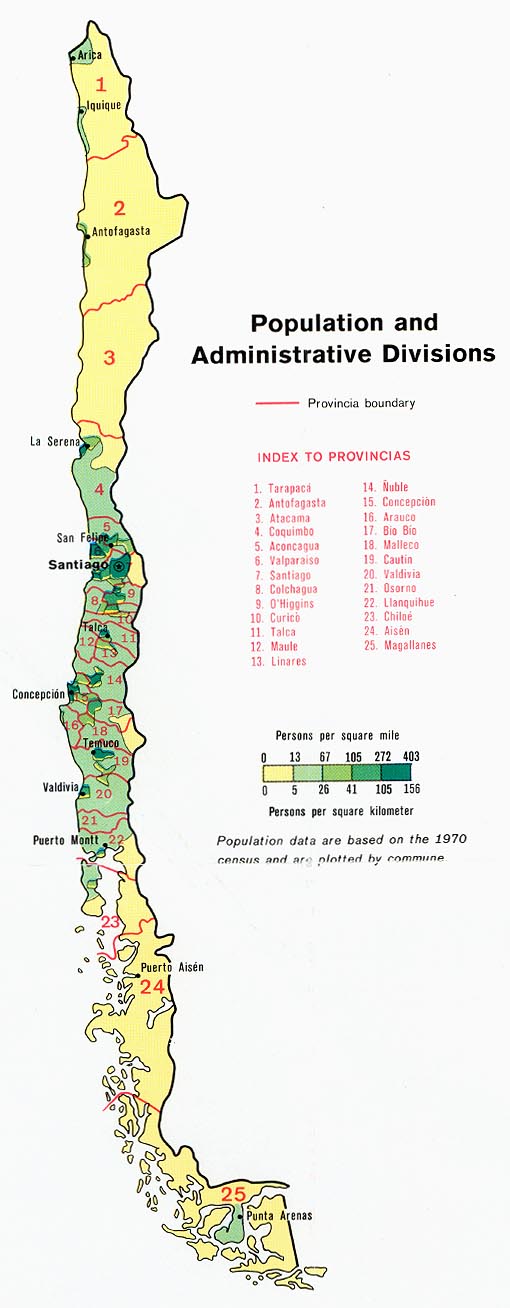
- Chile - Population and Administrative Divisions from Map No. 500814 1972 (98K)
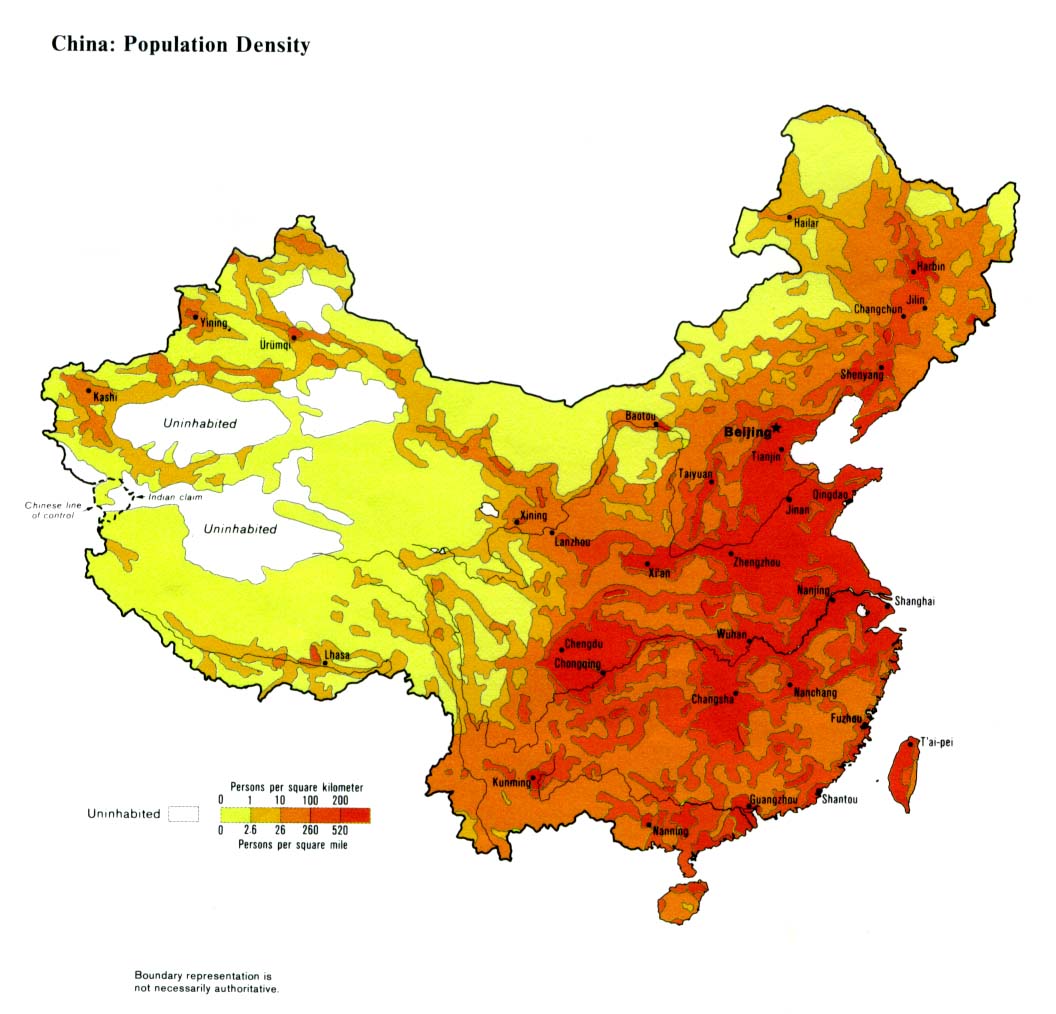
- China - Population Density 1983 (194K)
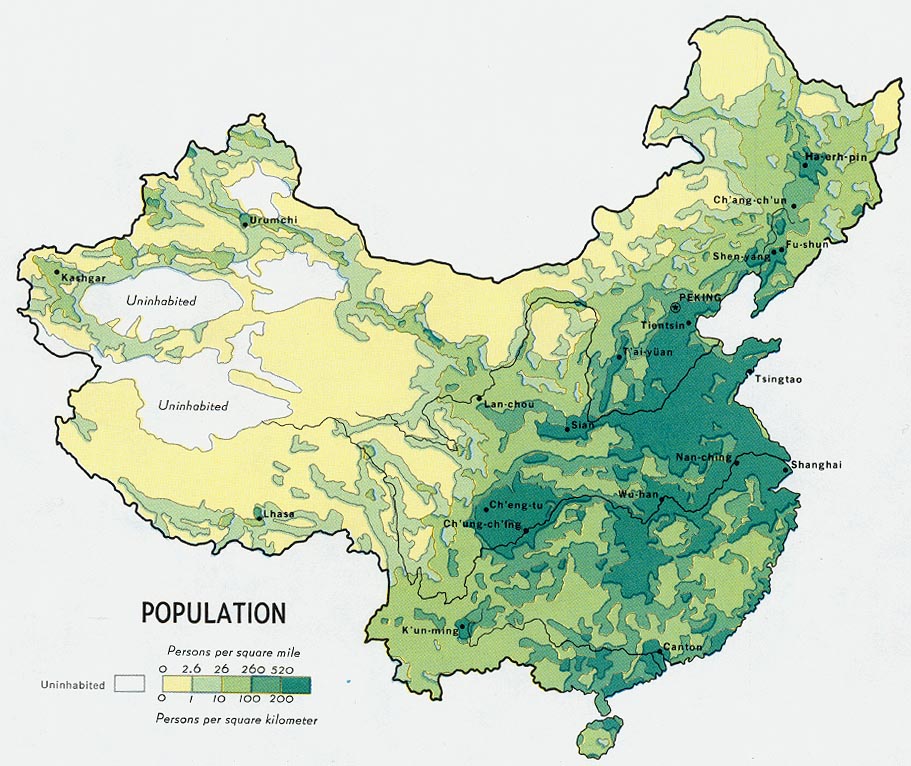
- China - Population from Map No. 500410 1971 (177K)
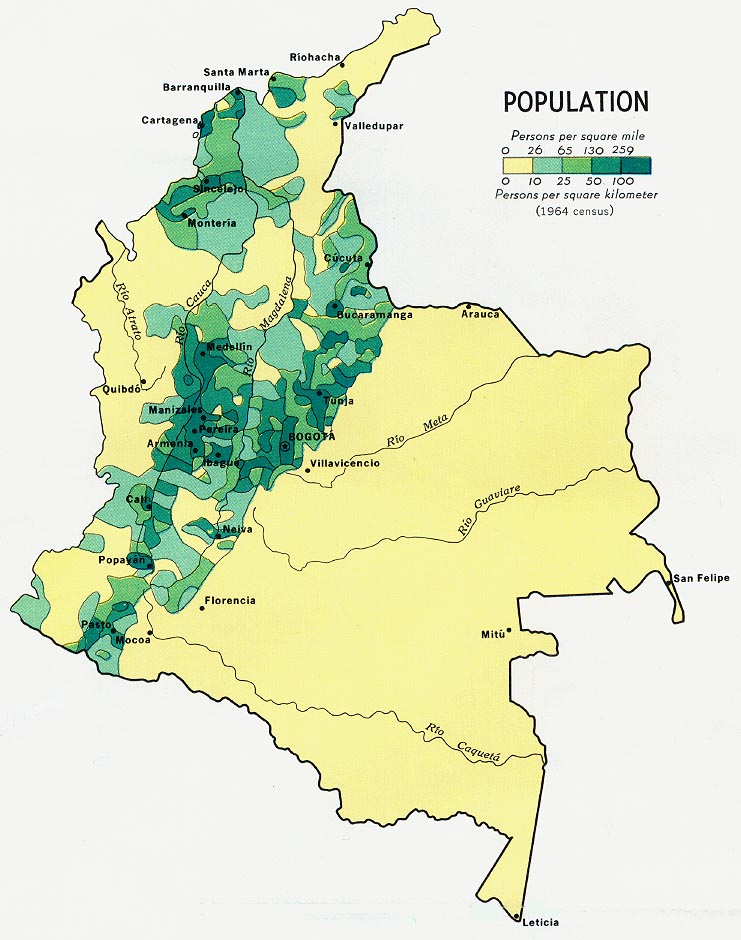
- Colombia - Population 1970 (138K)
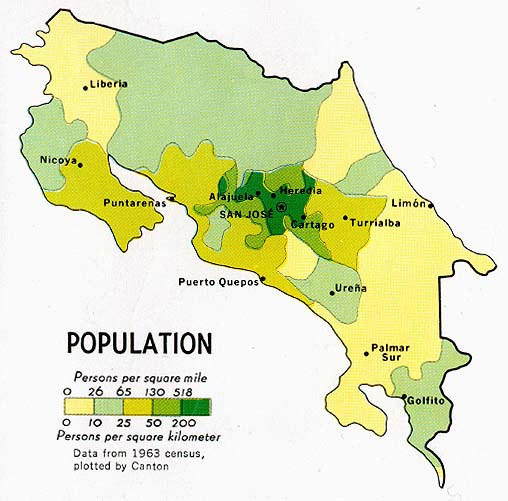
- Costa Rica - Population from Map No. 73665 1970 (73K)
- Croatia Population Density from Map No. 802345 1996 (107K)
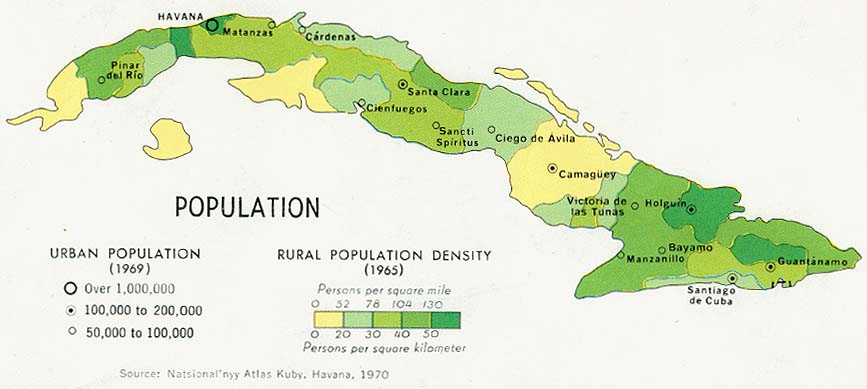
- Cuba - Population from Map No. 502988 1977 (63K)
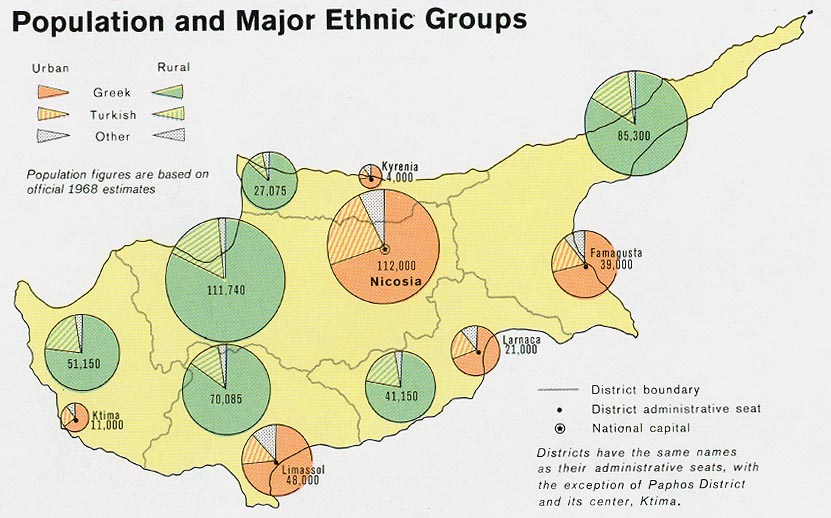
- Cyprus - Population from Map No. 500862 1972 (105K)
- [Czech and Slovak Republics] Czechoslovakia - Population Density from the CIA Atlas of the Eastern Europe 1990 (104K)
- [Czech and Slovak Republics] Czechoslovakia - Population from Map No. 501820 1974 (141K)
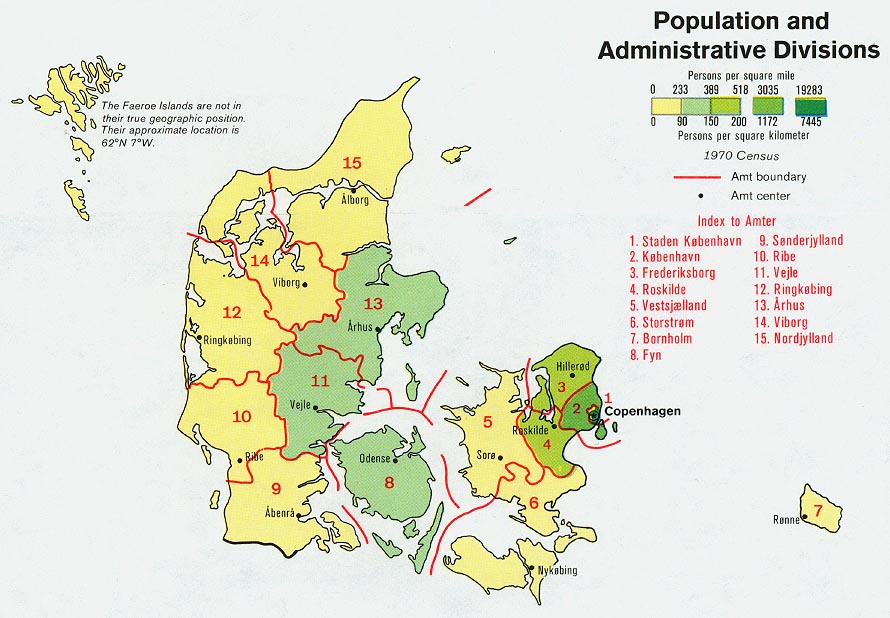
- Denmark - Population and Administrative Divisions from Map No. 501760 1974 (136K)
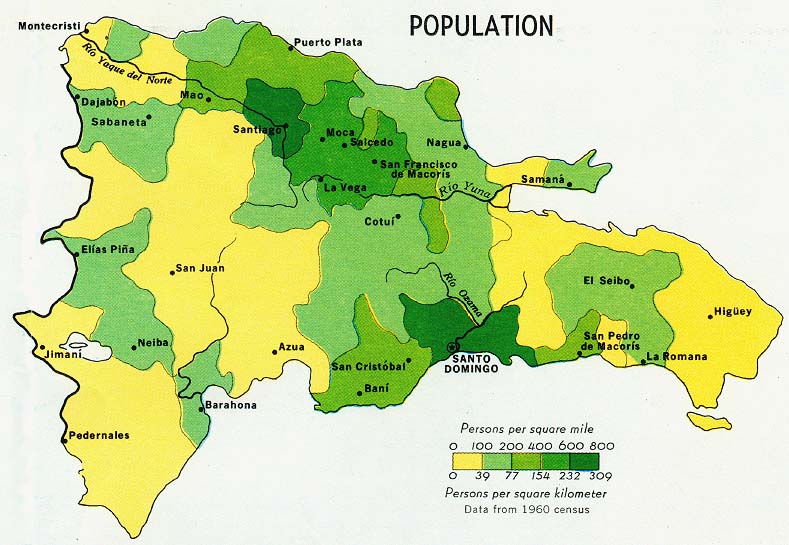
- Dominican Republic - Population from Map No. 78962 1971 (109K)
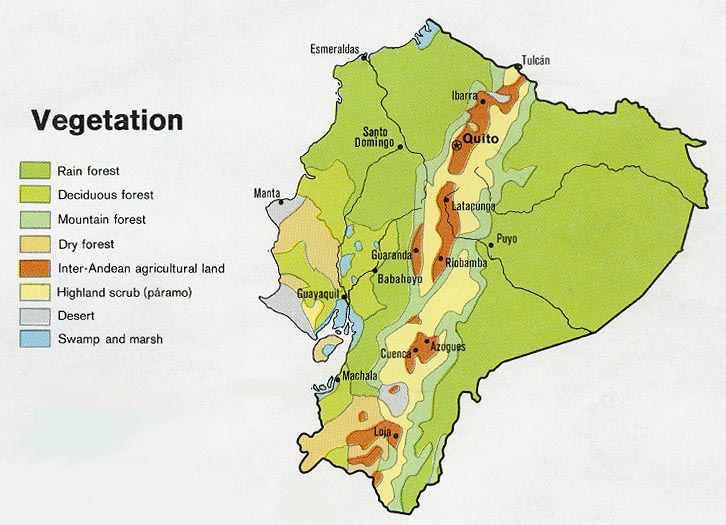
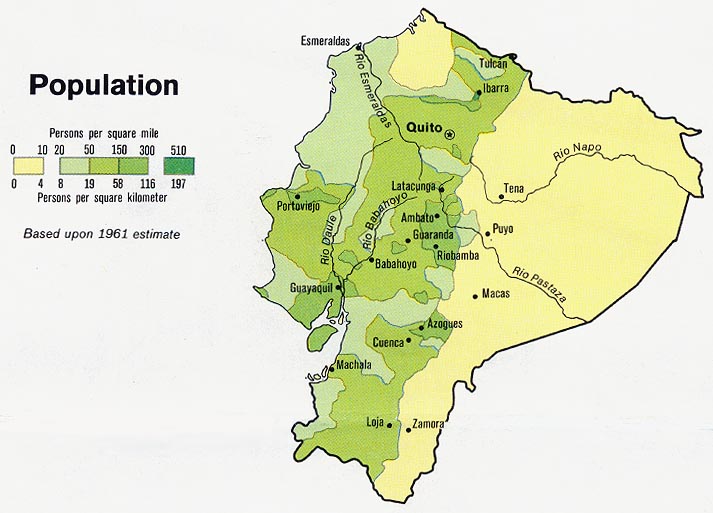
- Ecuador - Population from Map No. 501177 1973 (85K)
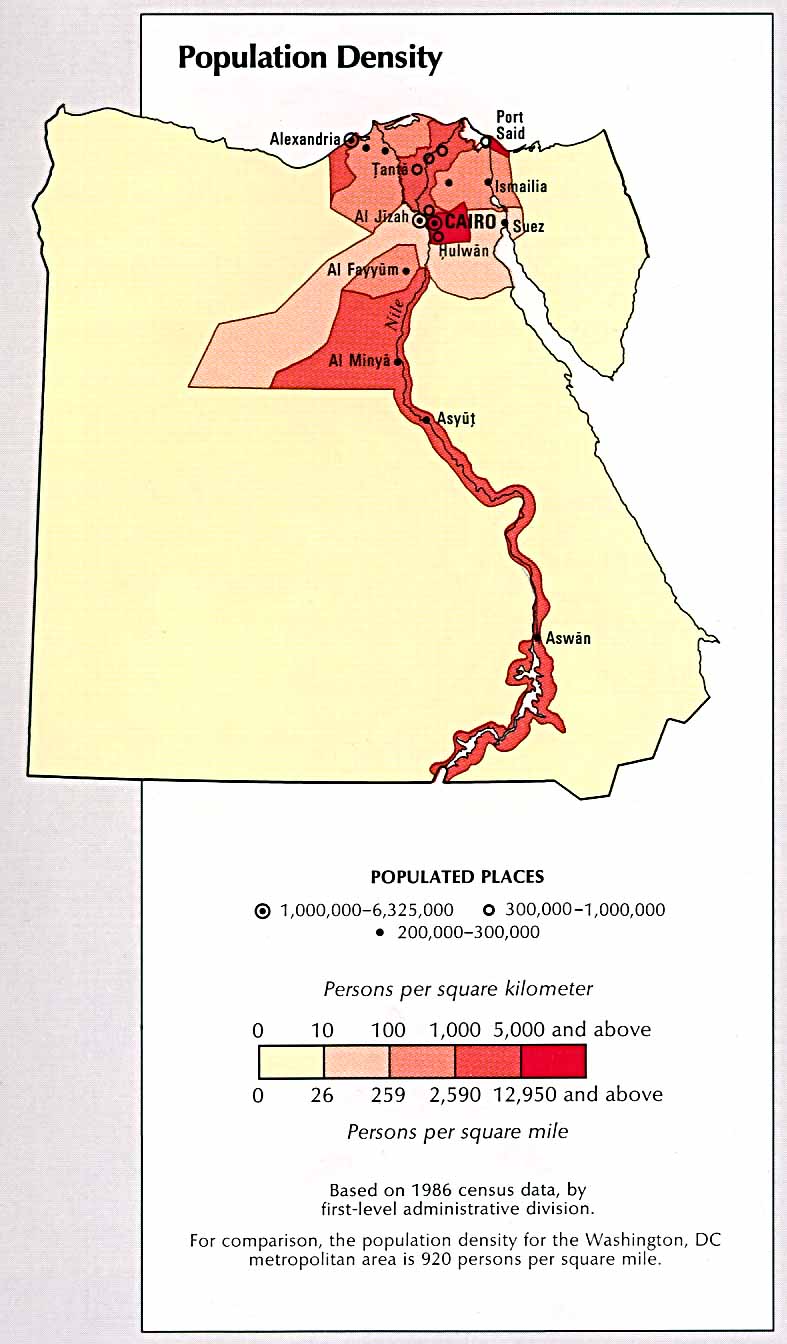
- Egypt - Population Density from the CIA Atlas of the Middle East 1993 (98K)
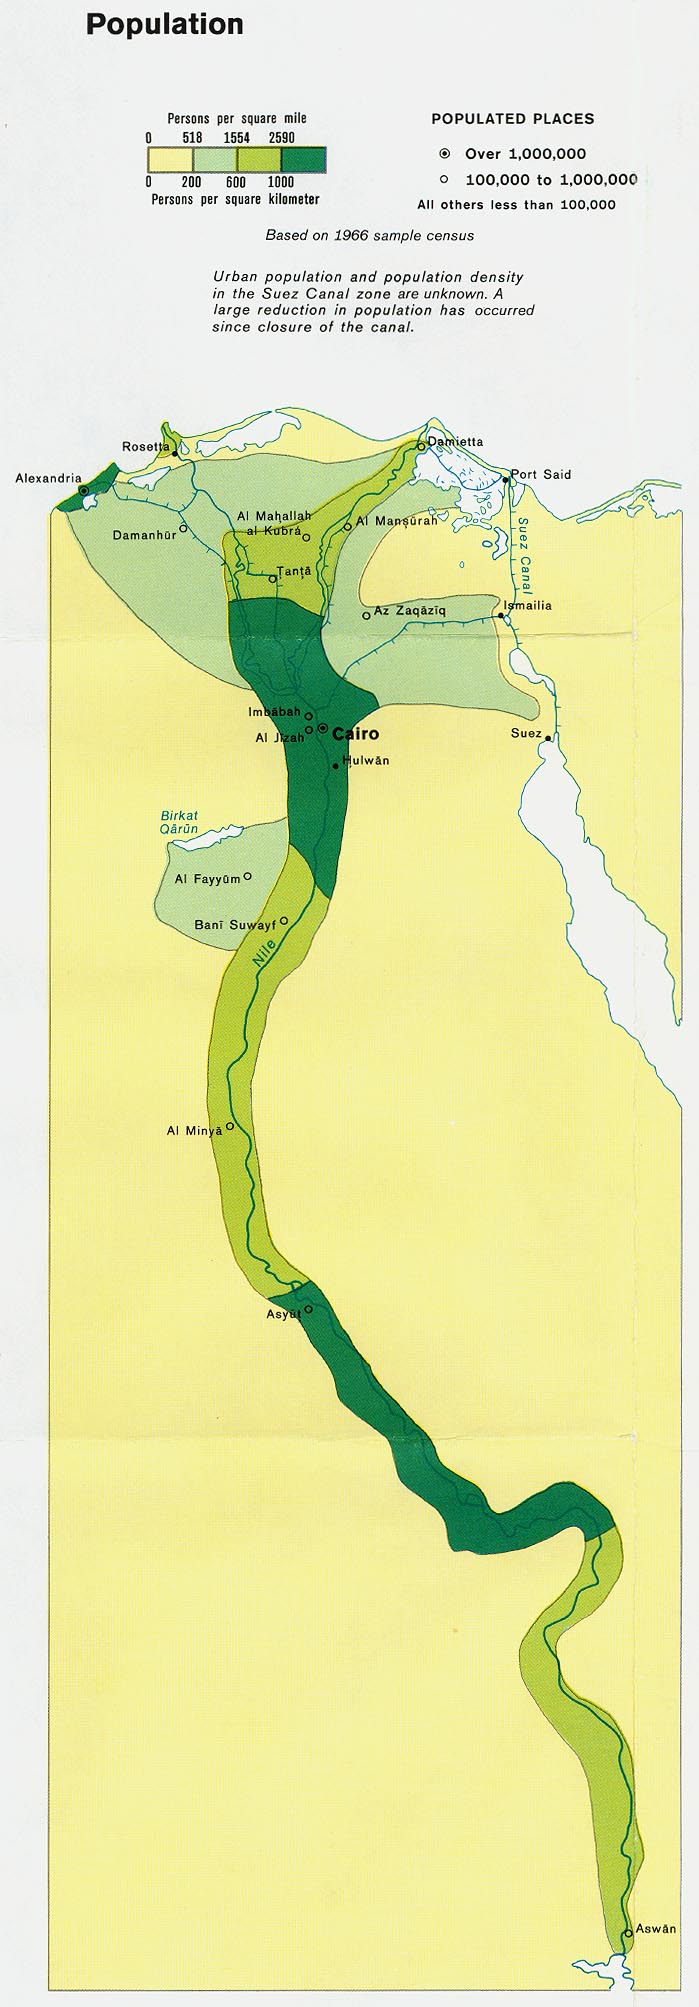
- Egypt - Population from Map No. 500648 1969 (172K)
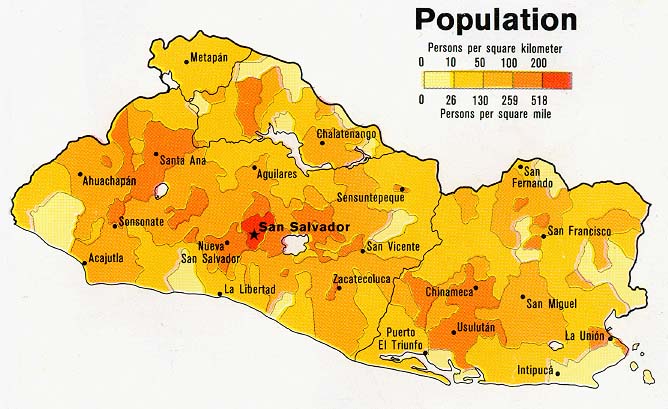
- El Salvador - Population from Map No. 504473 1980 (89K)
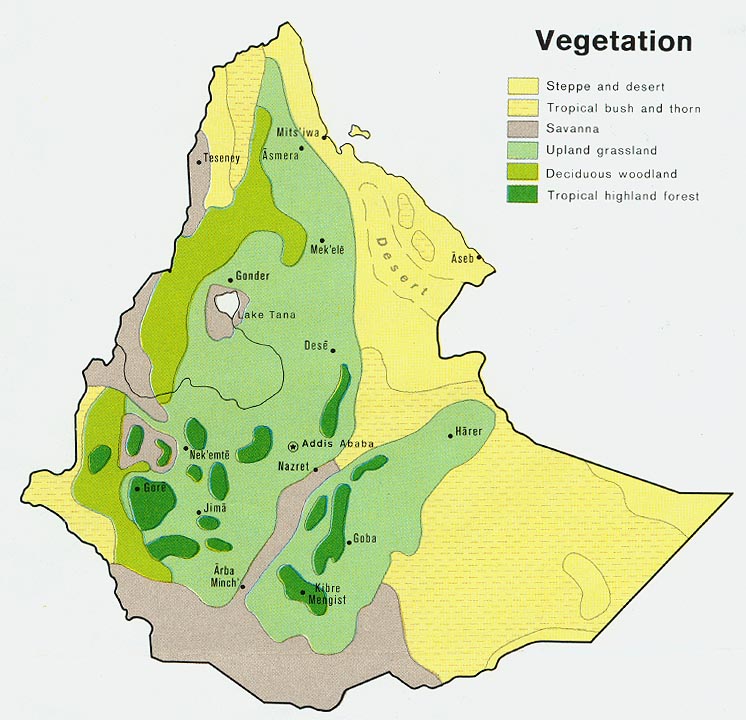
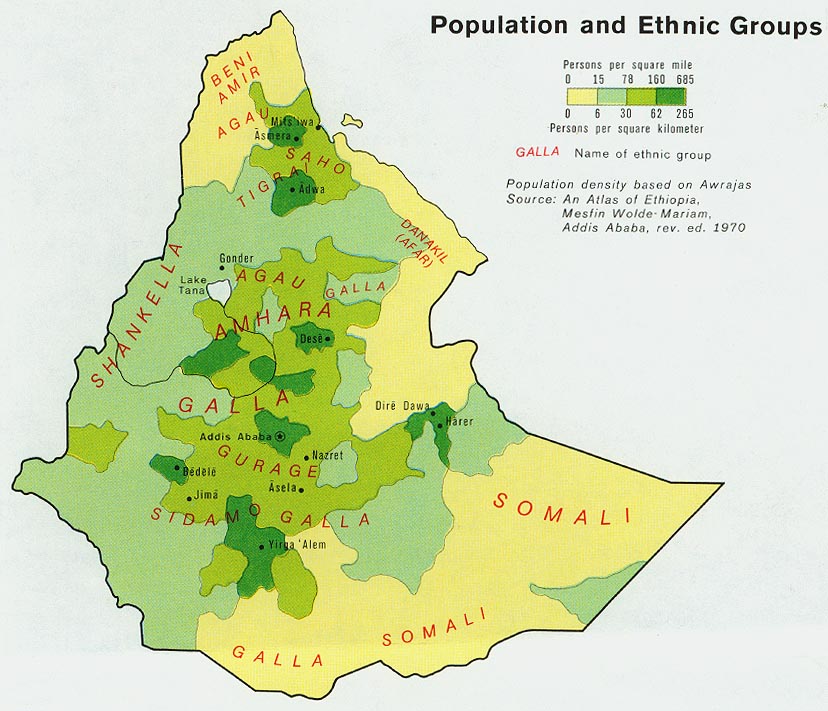
- Ethiopia - Population from Map No. 503188 1976 (127K)
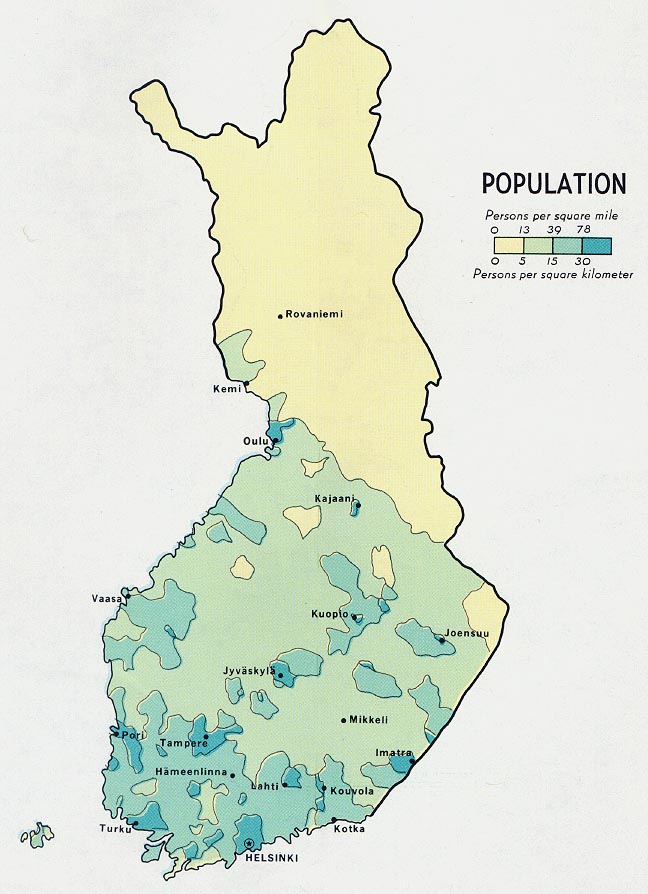
- Finland - Population from Map No. 58419 1969 (113K)
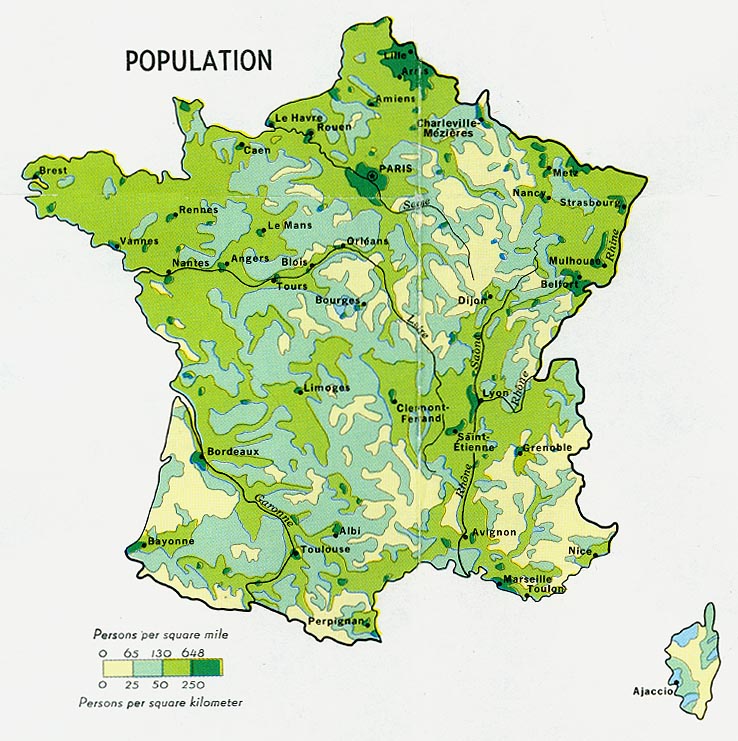
- France - Population from Map No. 500197 1972 (164K)
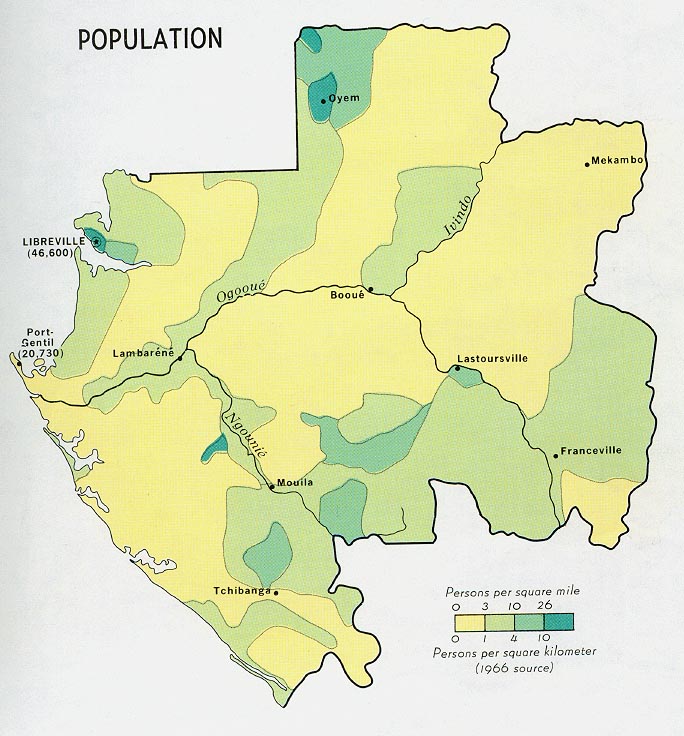
- Gabon - Population from Map No. 56867 1968 (118K)
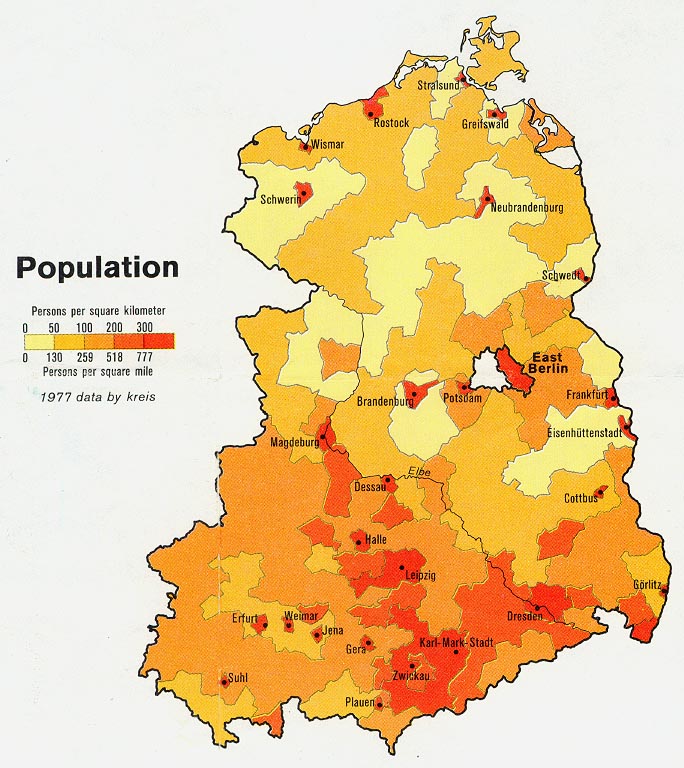
- Germany, Eastern - Population from Map No. 504708 1981 (131K)
- Germany, Eastern - Population Density from the CIA Atlas of Eastern Europe 1990 (115K)
- Germany, Western - Population from Map No. 500470 1972 (186K)
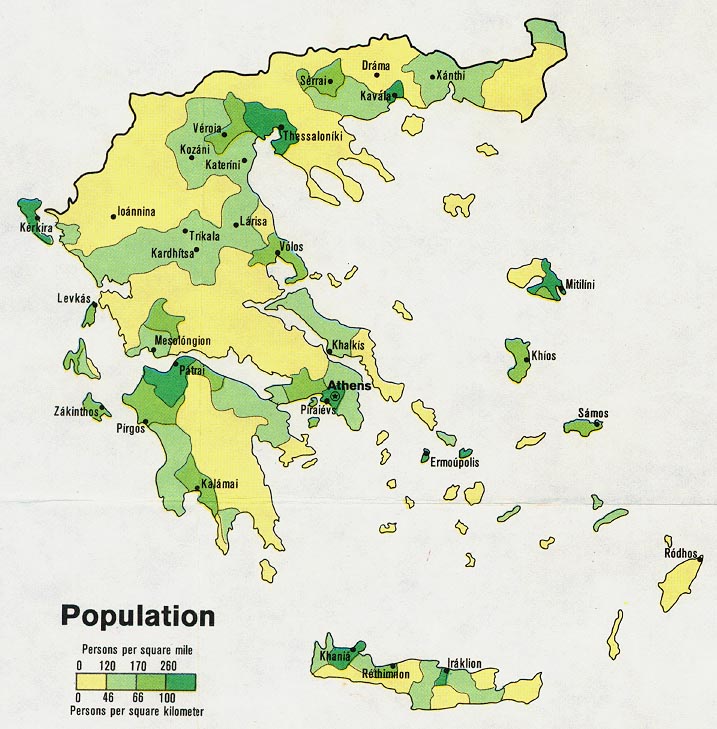
- Greece - Population from Map No. 501684 1973 (130K)
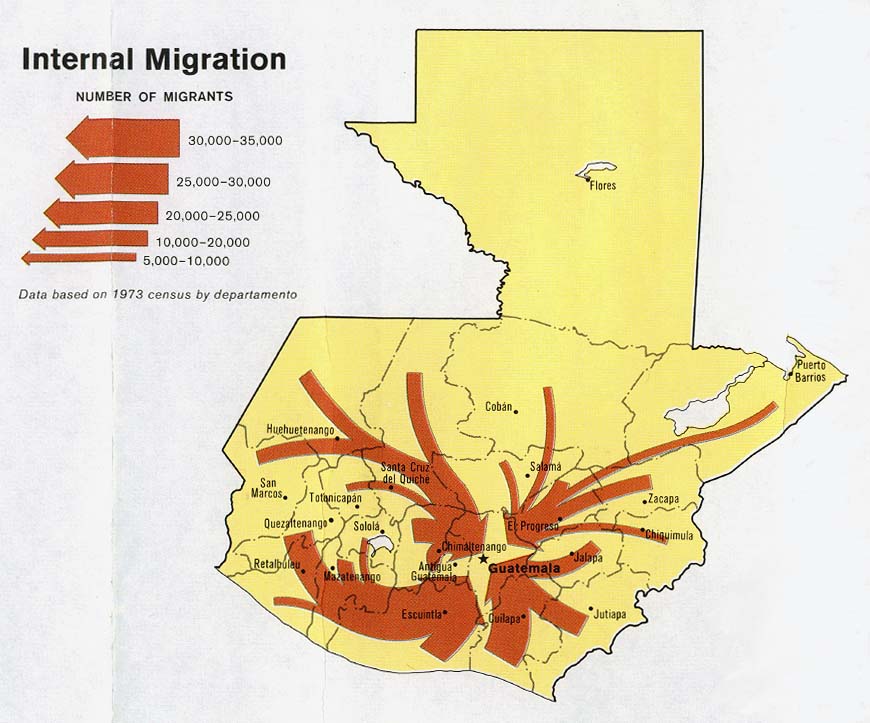
- Guatemala - Internal Migration from Map No. 504829 1983 (108K)
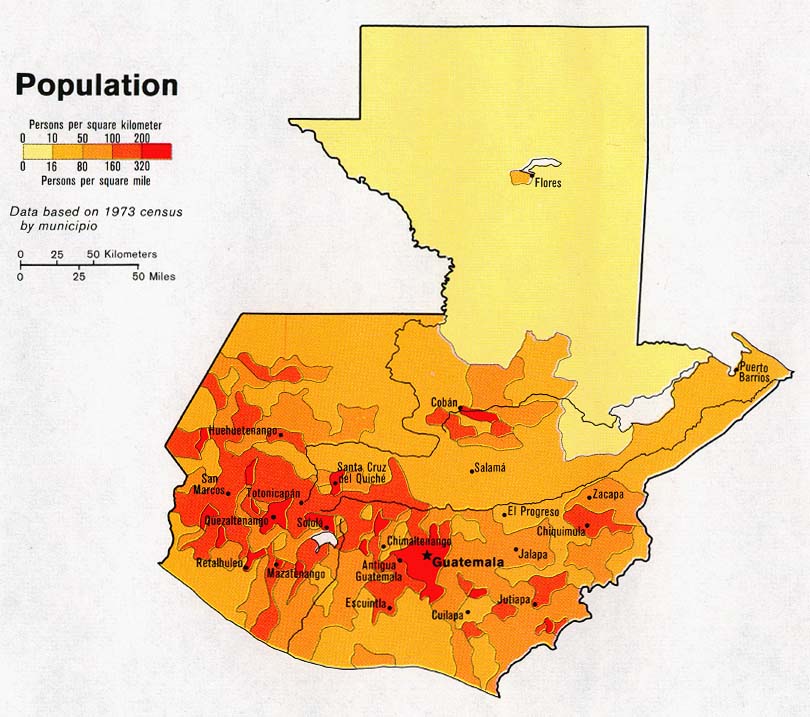
- Guatemala - Population from Map No. 504829 1983 (115K)
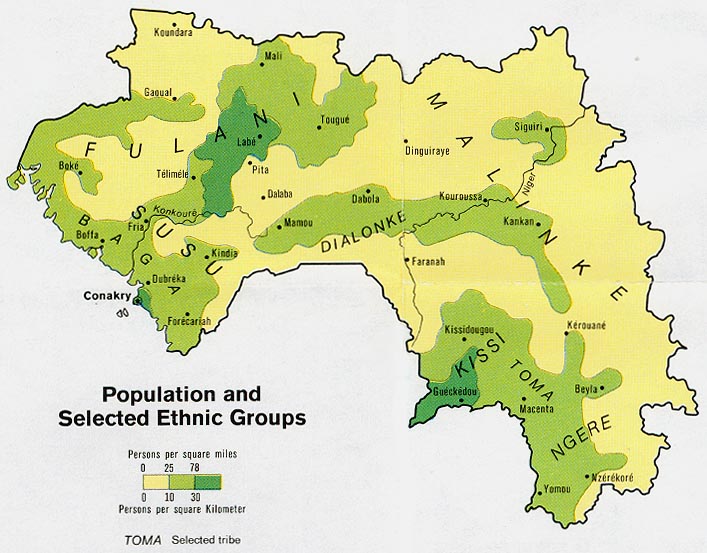
- Guinea - Population and Selected Ethnic Groups from Map No. 501172 1973 (111K)
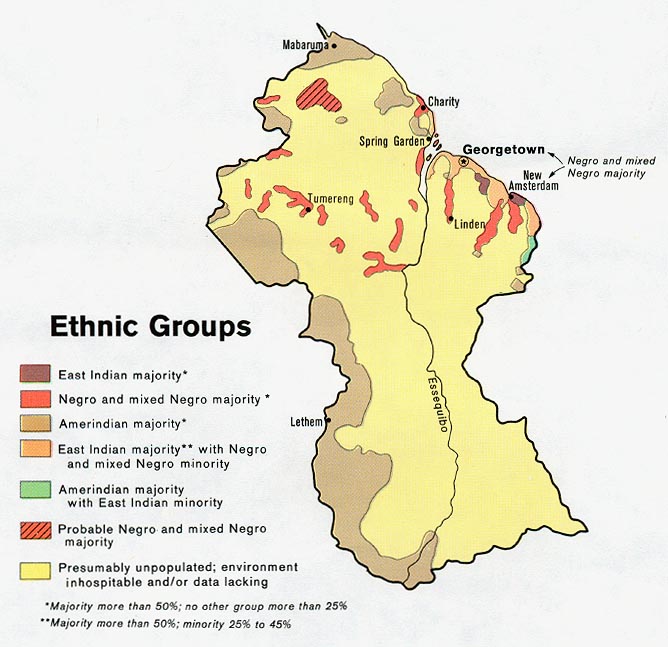
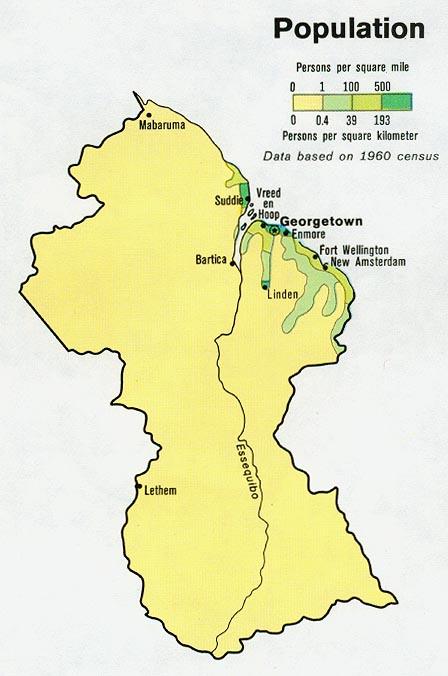
- Guyana - Population from Map No. 500987 1973 (68K)
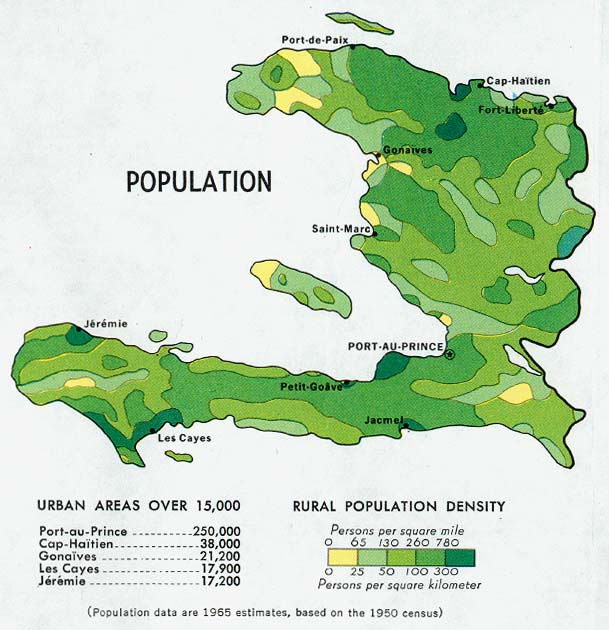
- Haiti - Population from Map No. 77972 1970 (96K)
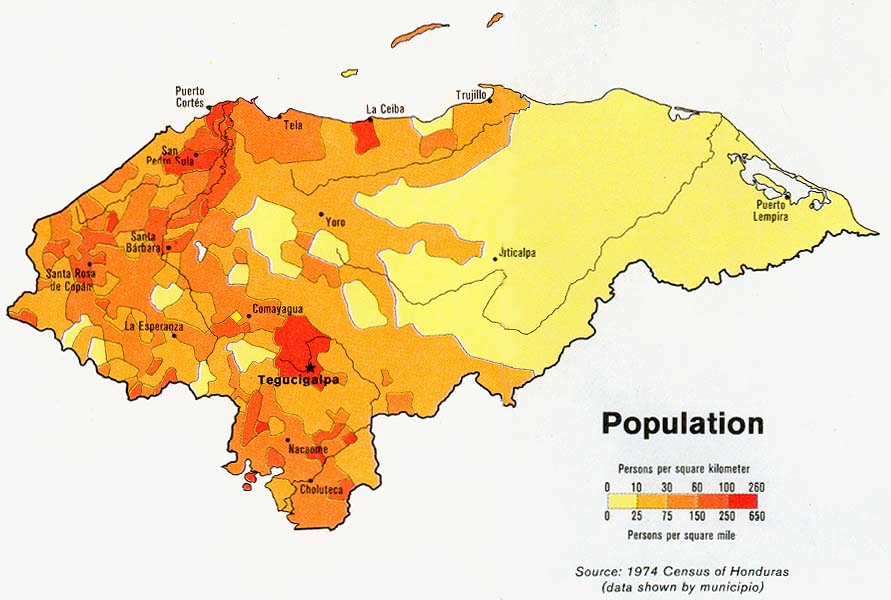
- Honduras - Population from Map No. 504929 1983 (95K)
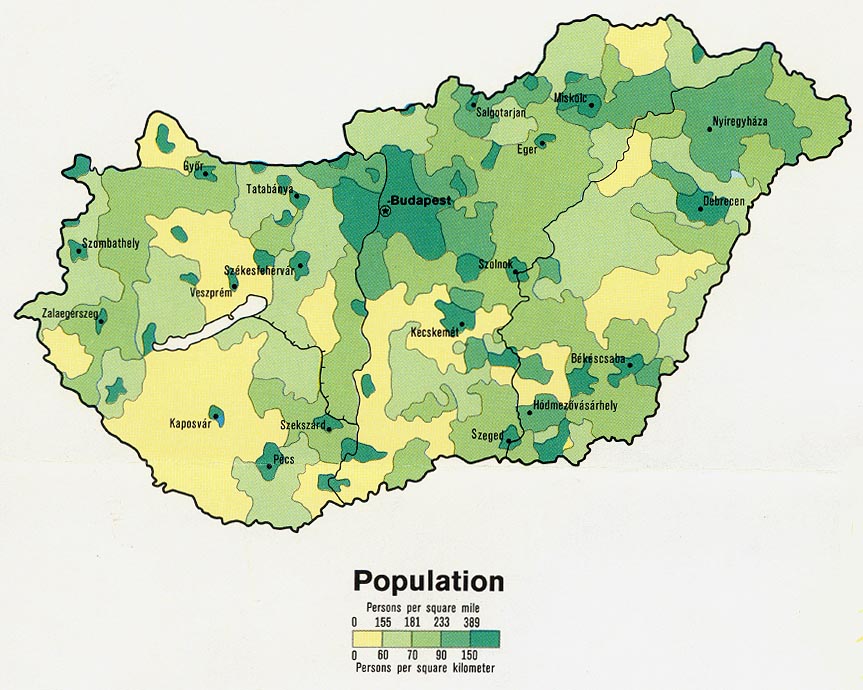
- Hungary - Population from Map No. 501074 1973 (143K)
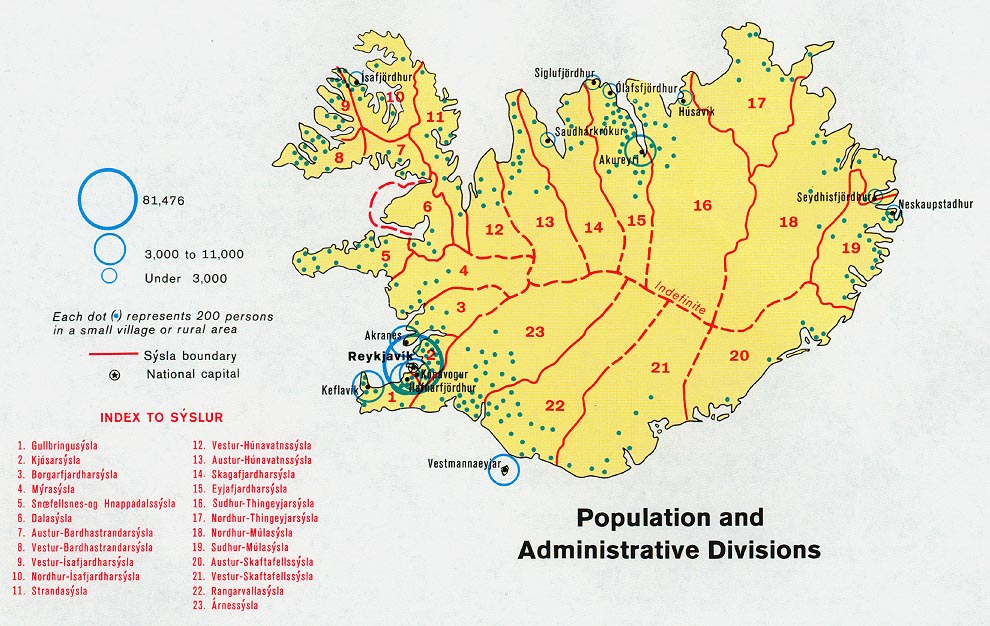
- Iceland - Population and Administrative Divisions from Map No. 500975 1973 (177K)
- India - Population from Map No. 501057 1973 (186K)
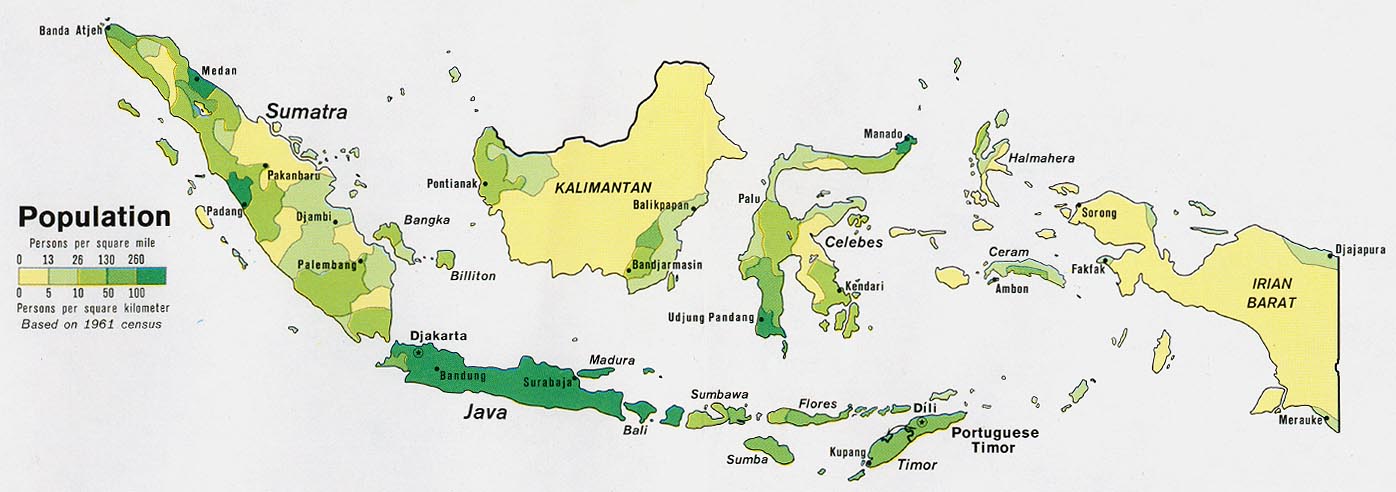
- Indonesia - Population from Map No. 500869 1972 (111K)
- Iran - Population Density from the CIA Atlas of the Middle East 1993 (108K)
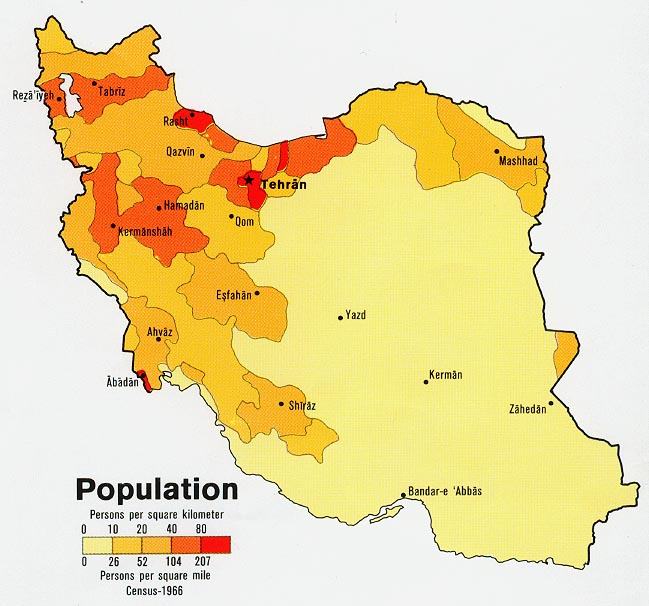
- Iran - Population from Map No. 503828 1978 (97K)
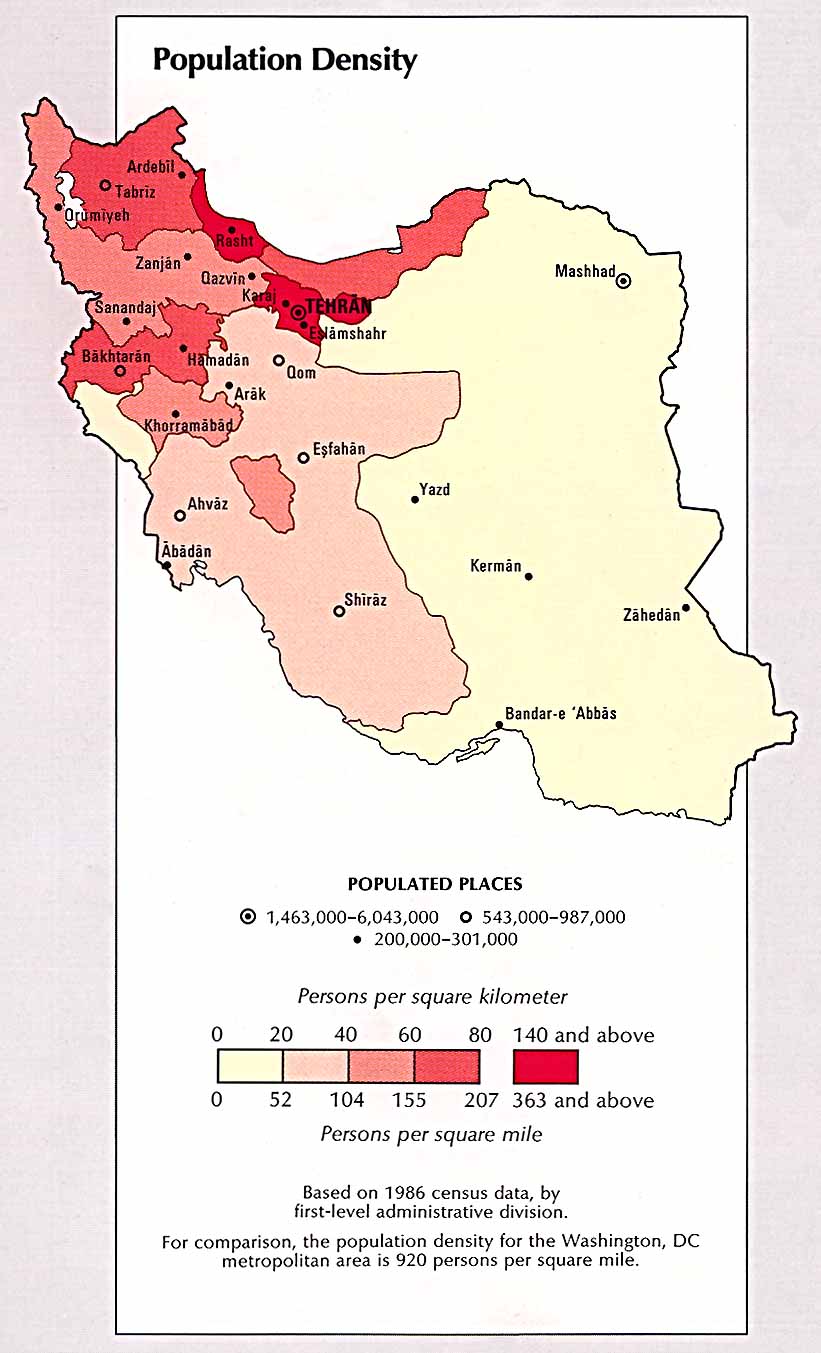
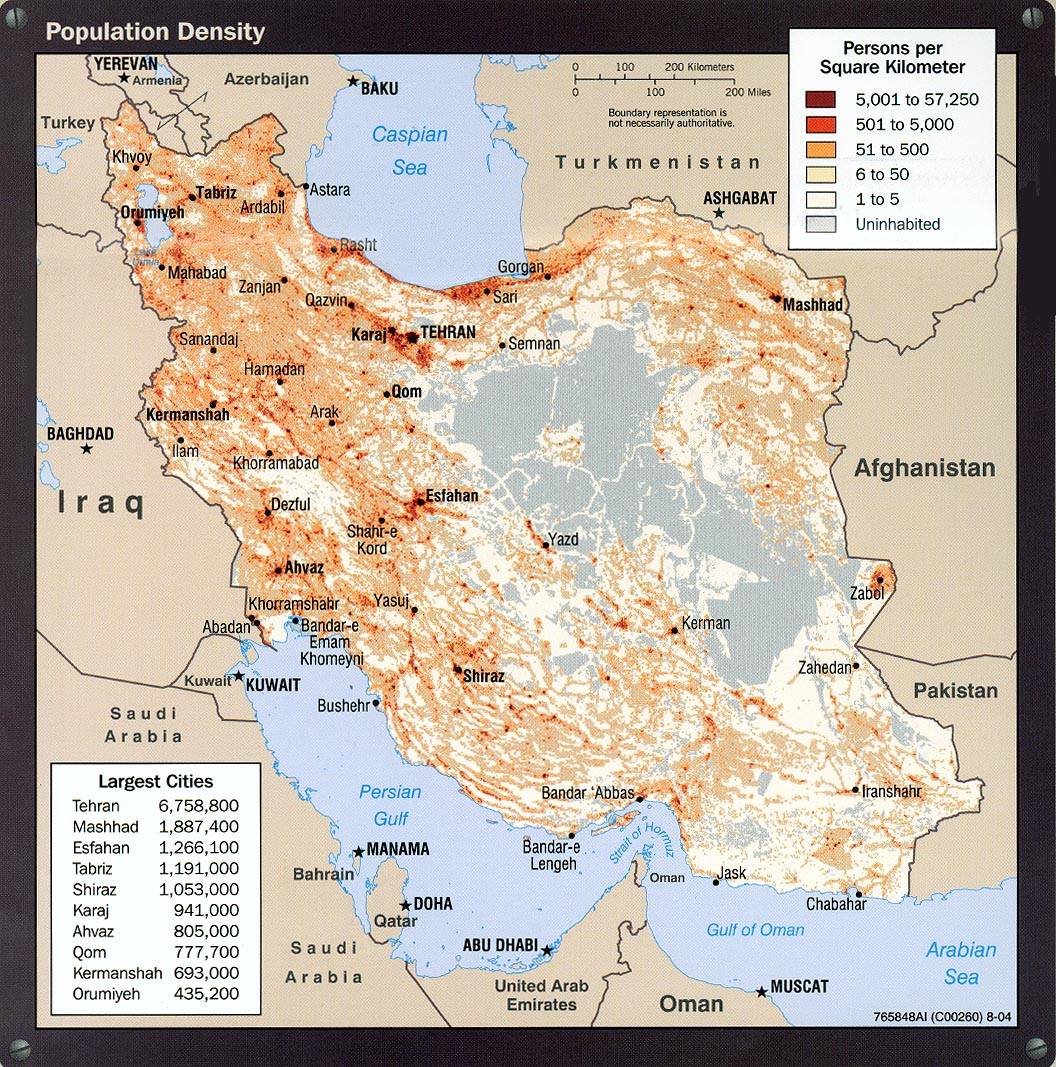
- Population Density 2004 from Iran: Country Profile [map] (413K)
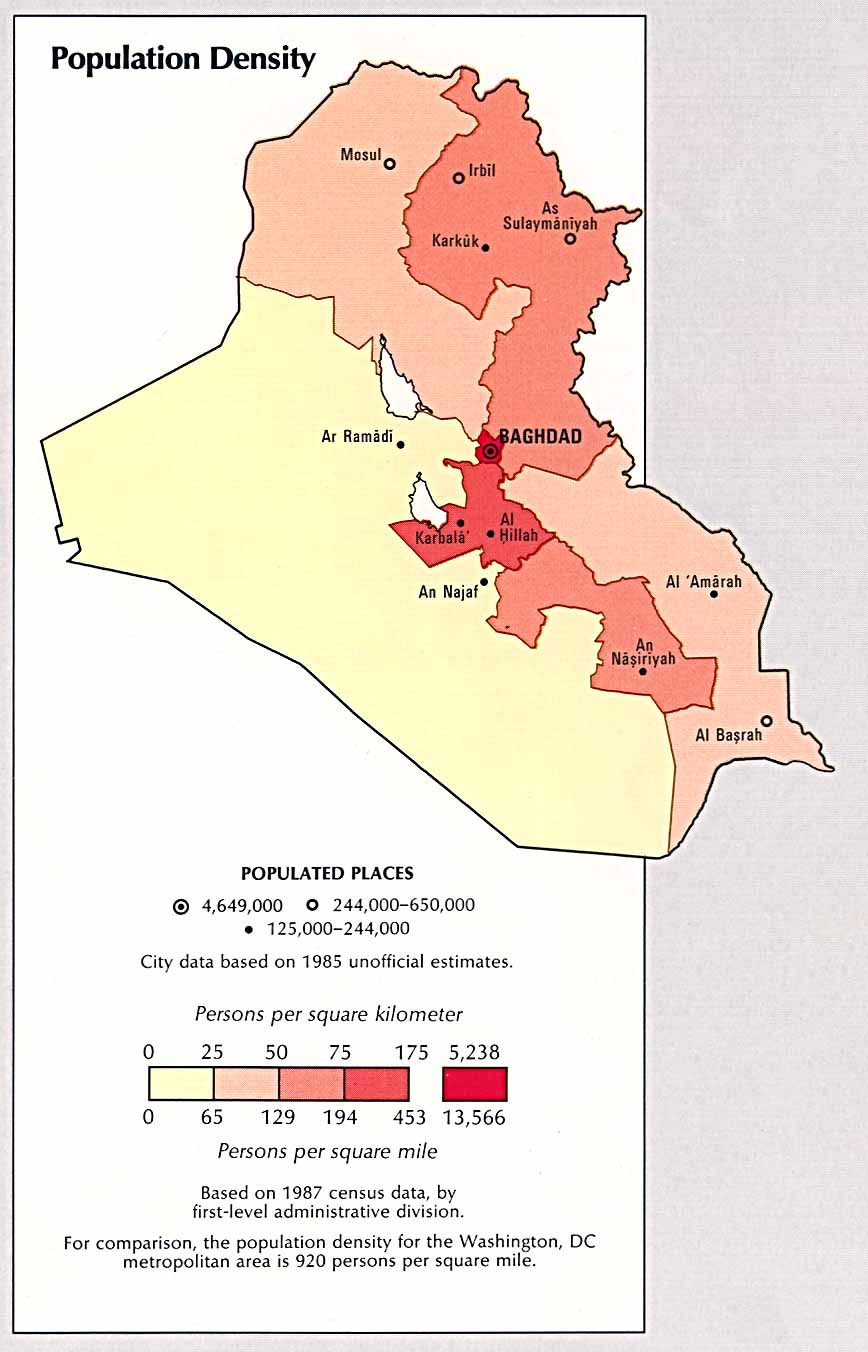
- Iraq - Population Density from the CIA Atlas of the Middle East 1993 (99K)
- Iraq - Population Density from Atlas of the Middle East, CIA, 1993 (185K)
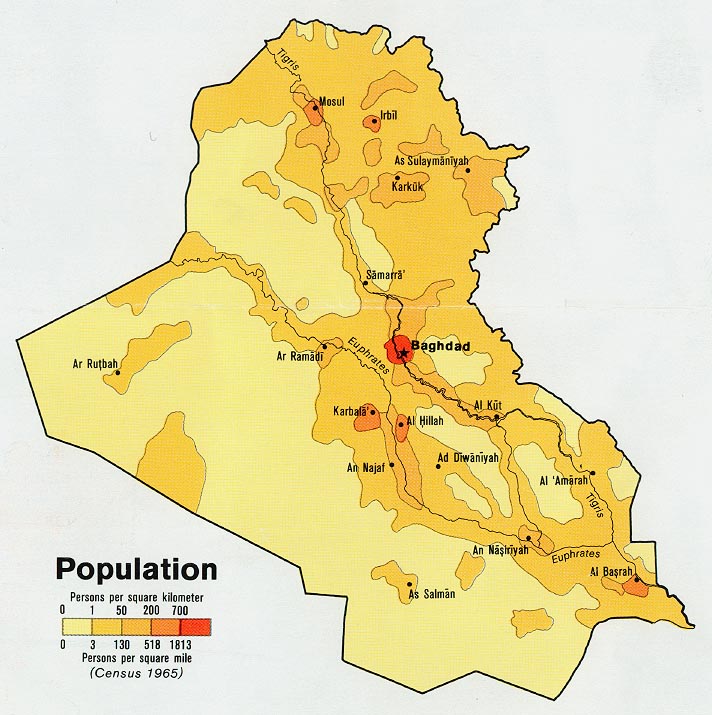
- Iraq - Population from Map No. 503930 1978 (124K)
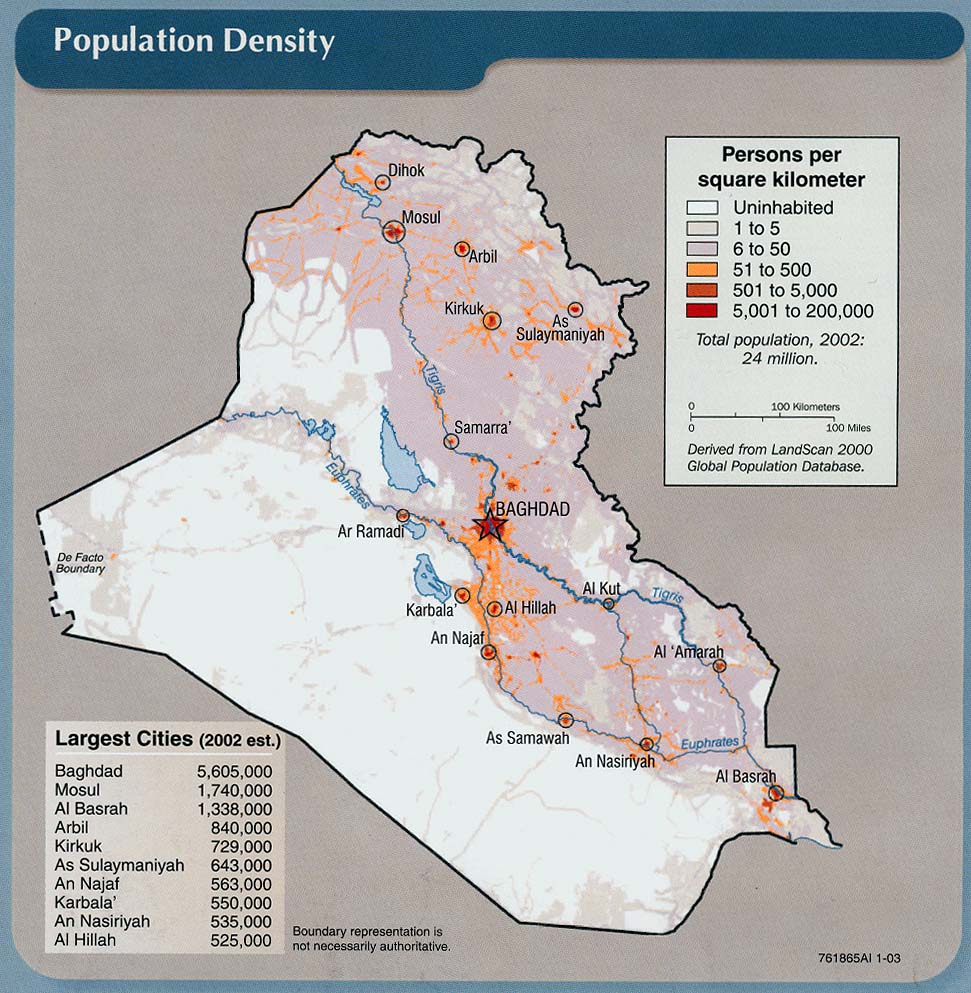
- Iraq - Population Density from Iraq: Country Profile [map], CIA, January 2003 (213K) and
pdf format (183K)
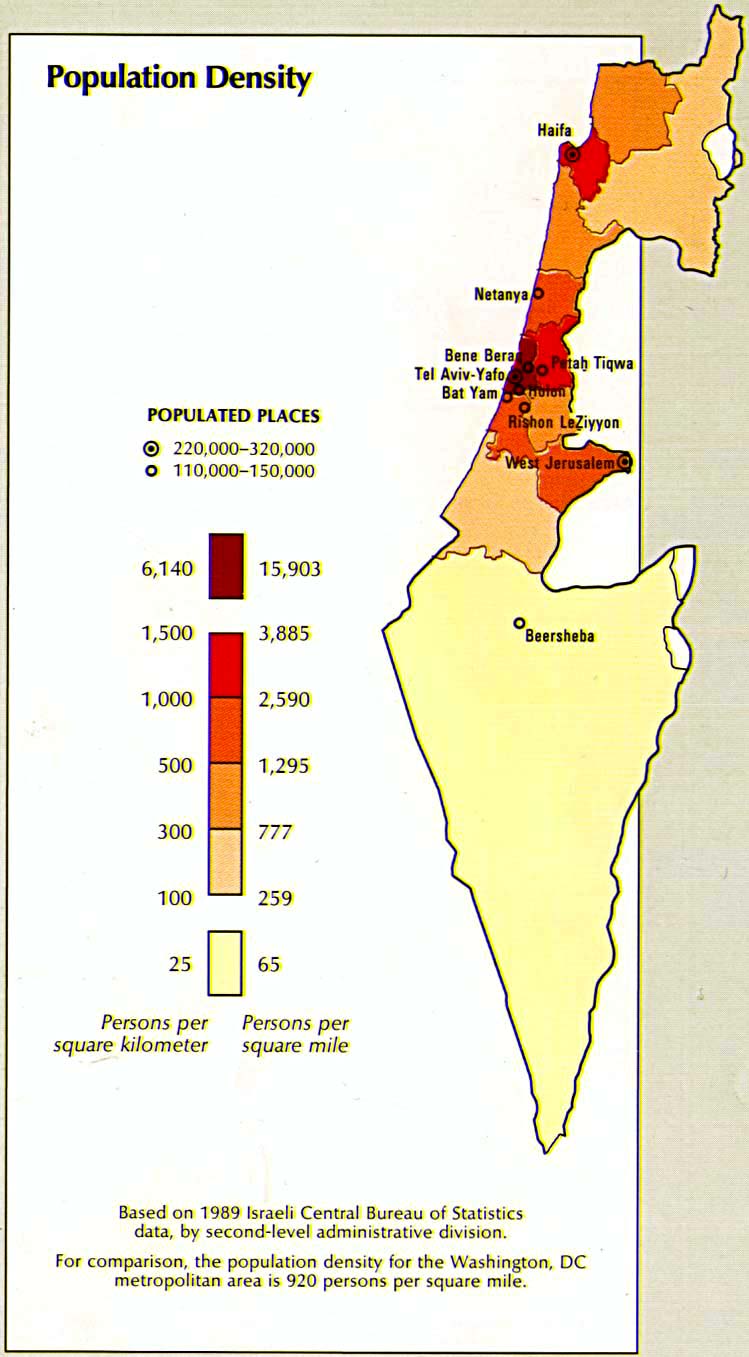
- Israel - Population Density from the CIA Atlas of the Middle East 1993 (114K)
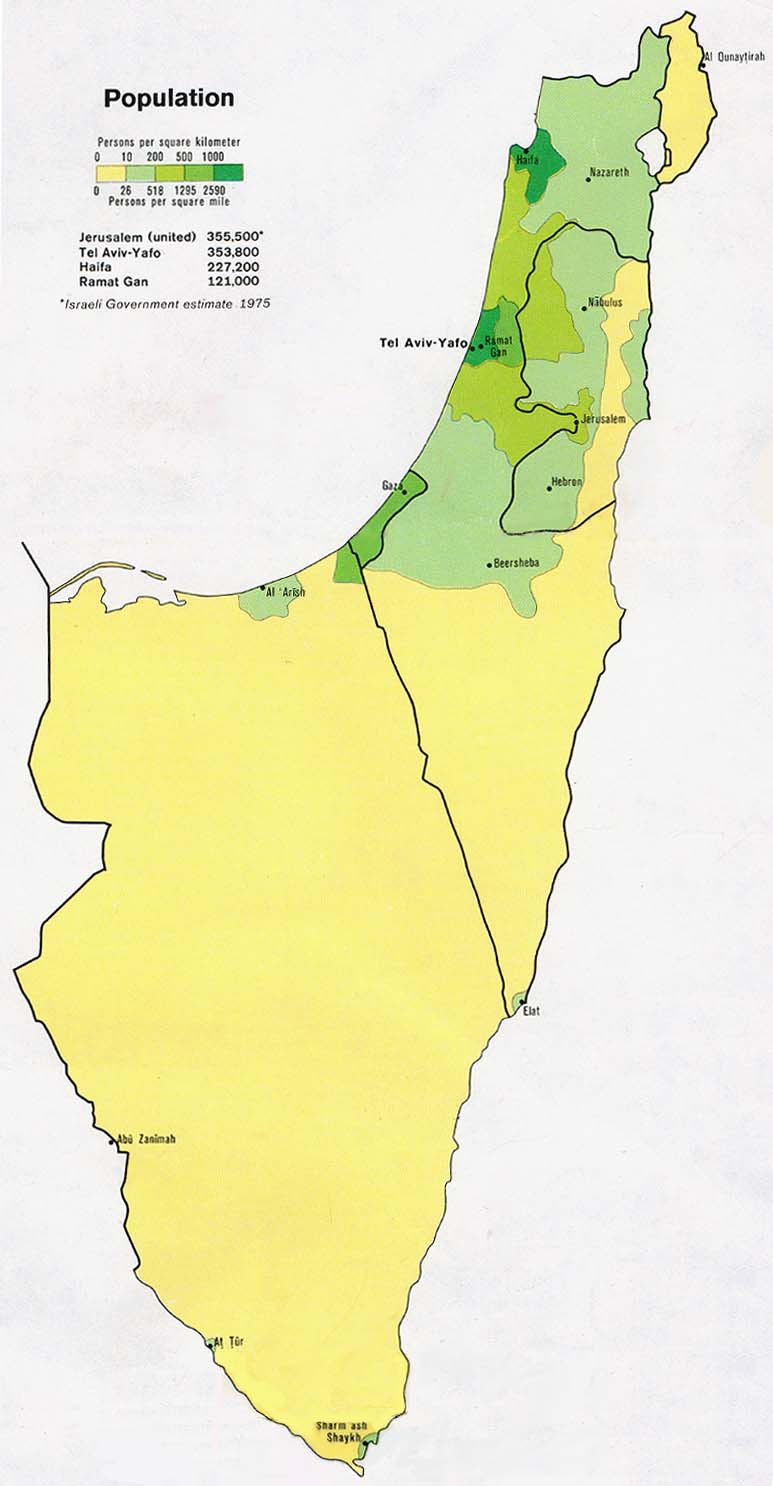
- Israel - Population from Map No. 503499 1978 (87K)
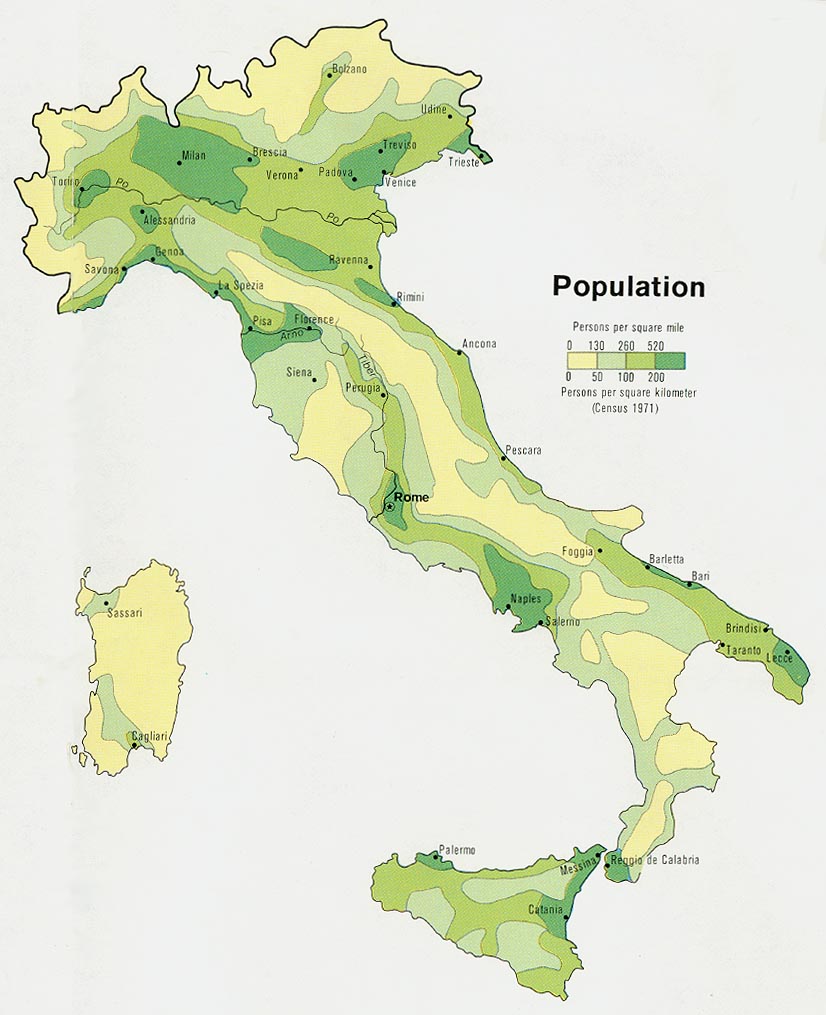
- Italy - Population from Map No. 501445 1972 (127K)
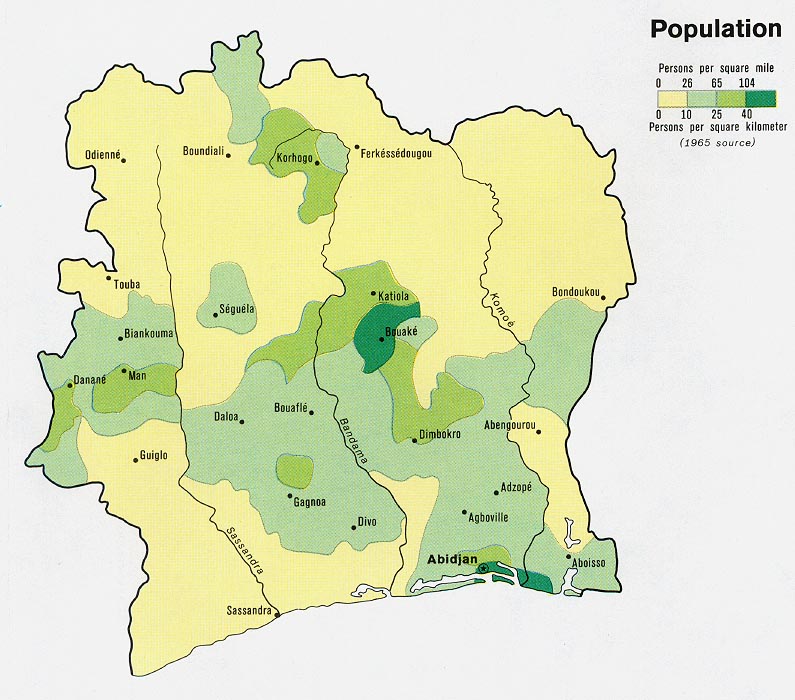
- Ivory Coast - Population from Map No. 500455 1972 (147K)
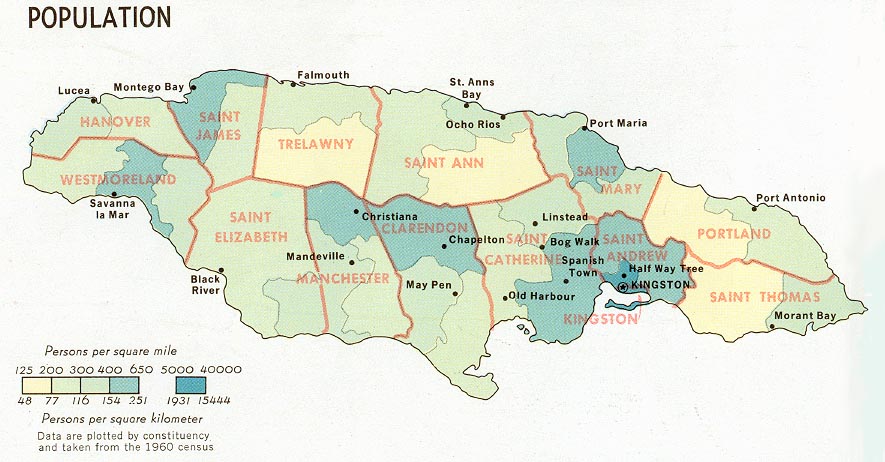
- Jamaica - Population from Map No. 58780 1968 (107K)
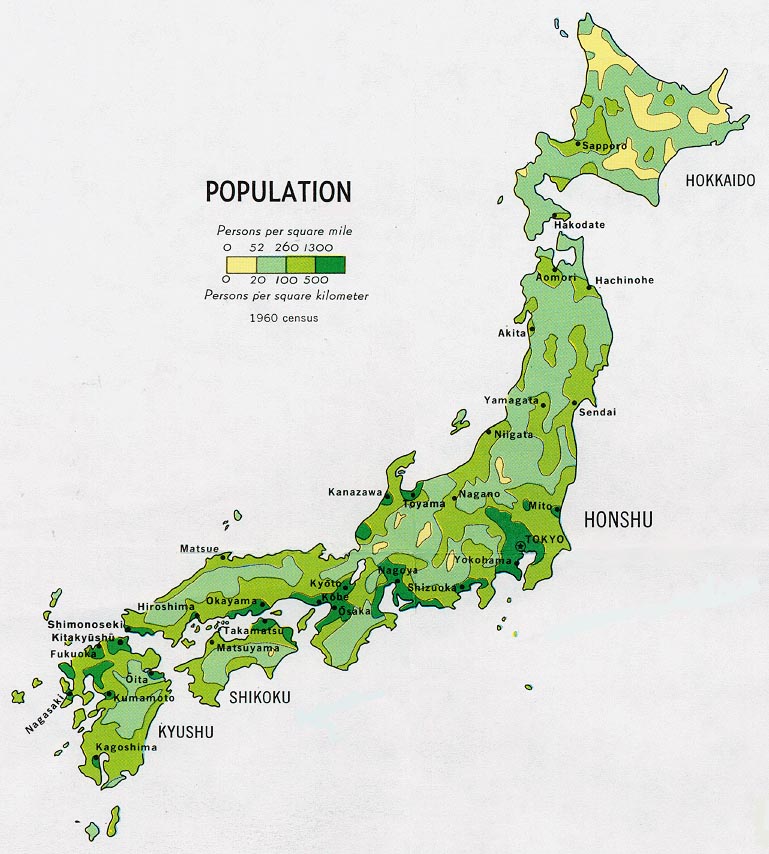
- Japan - Population from Map No. 78643 1971 (135K)
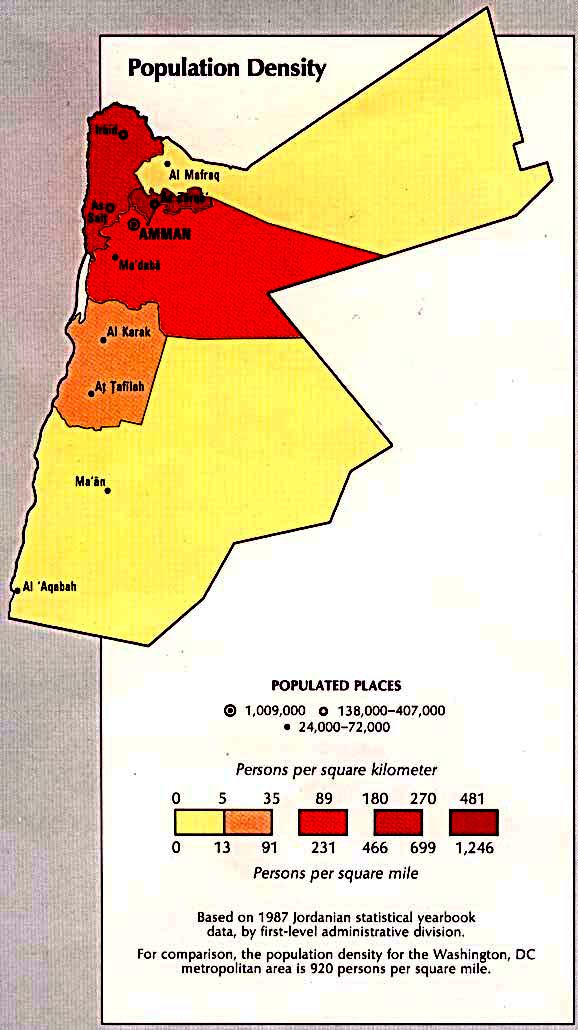
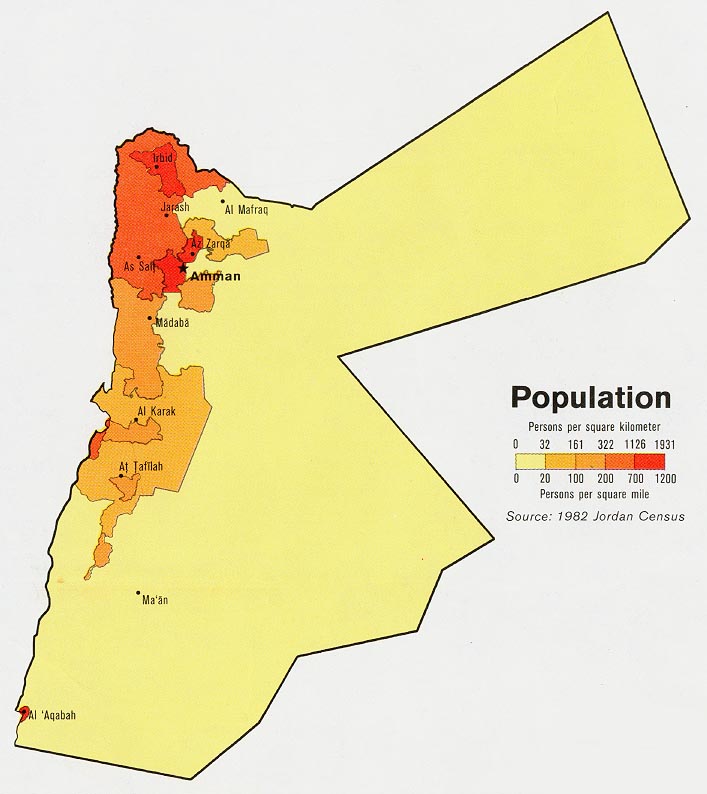
- Jordan - Population Density from the CIA Atlas of the Middle East 1993 (84K)
- Jordan - Population from Map No. 505911 1978 (85K)
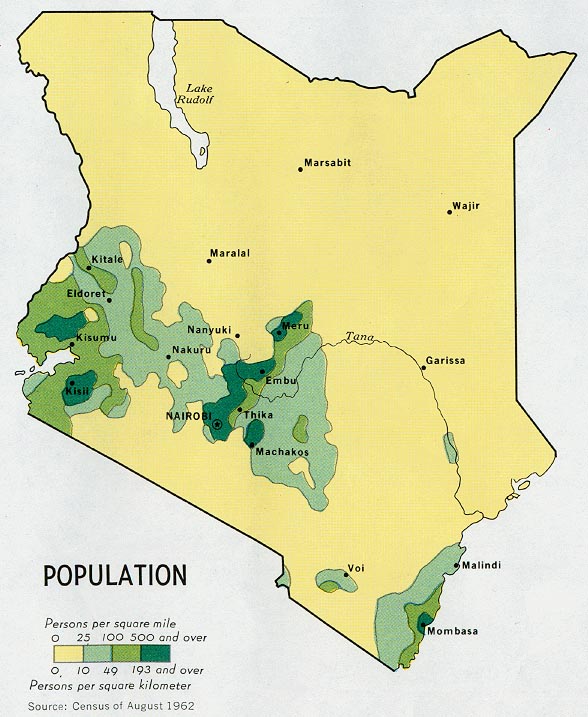
- Kenya - Population from Map No. 501721 1974 (158K)
- Korea [North] - Population from Map No. 500773 1972 (107K)
- Korea [South] - Population from Map No. 501879 1973 (146K)
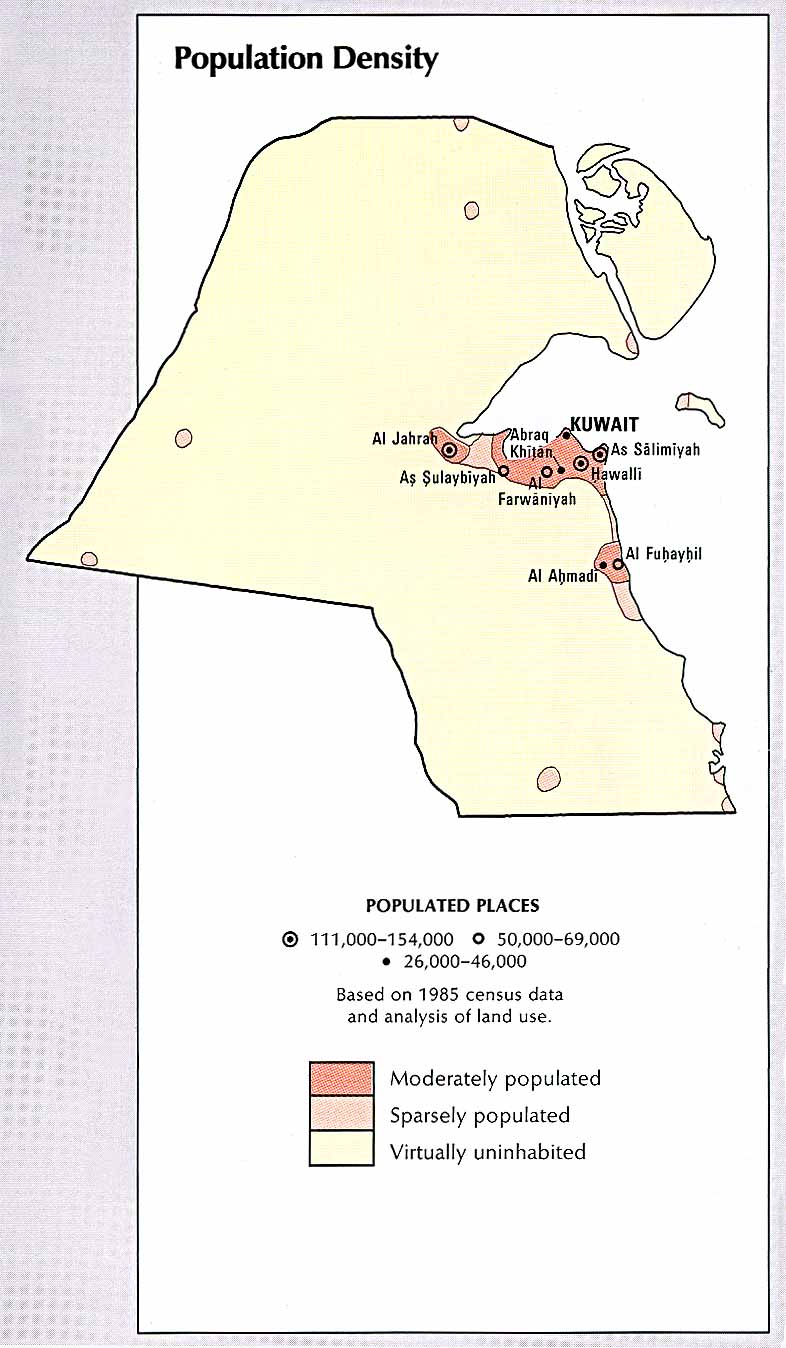
- Kuwait - Population Density from the CIA Atlas of the Middle East 1993 (107K)
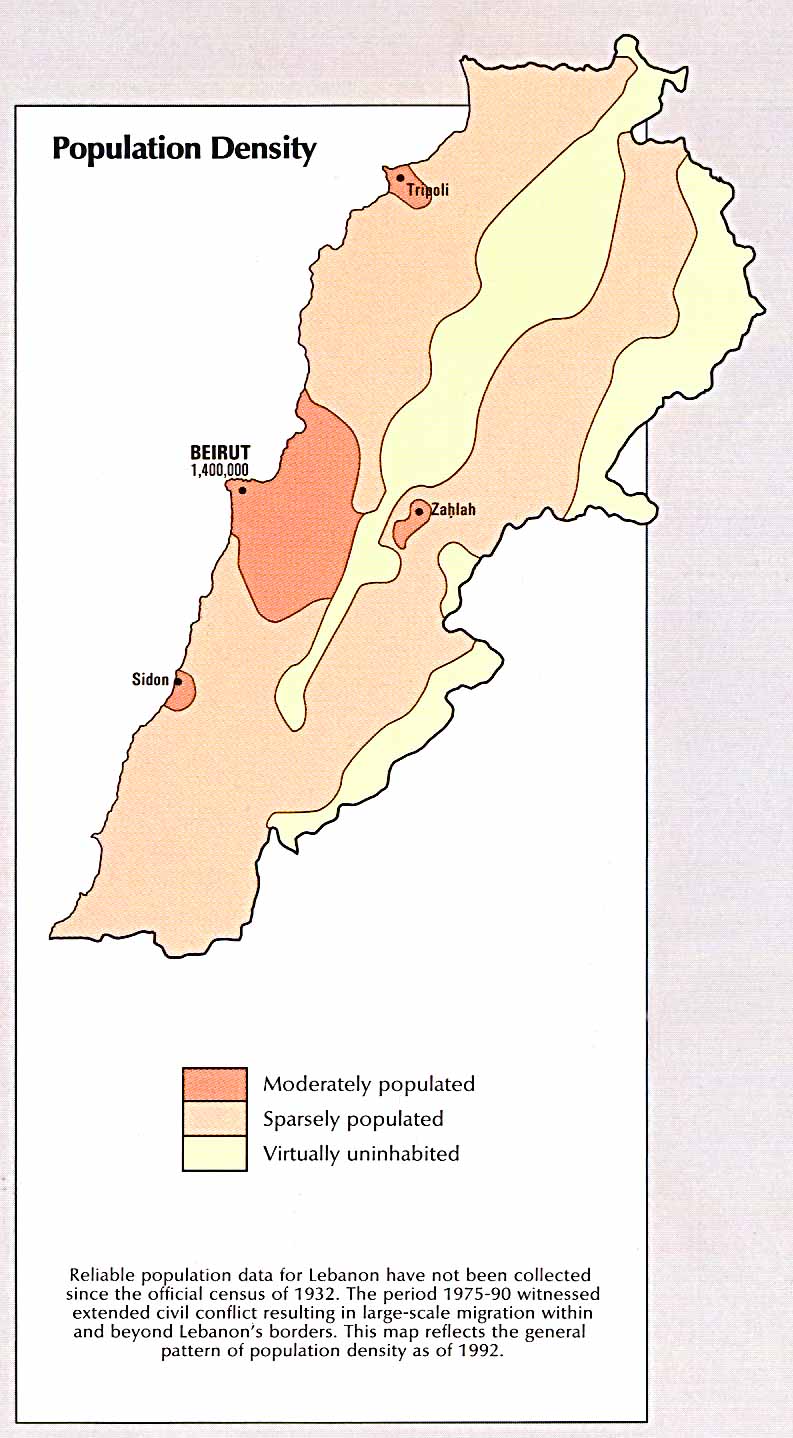
- Lebanon - Population Density from the CIA Atlas of the Middle East 1993 (119K)
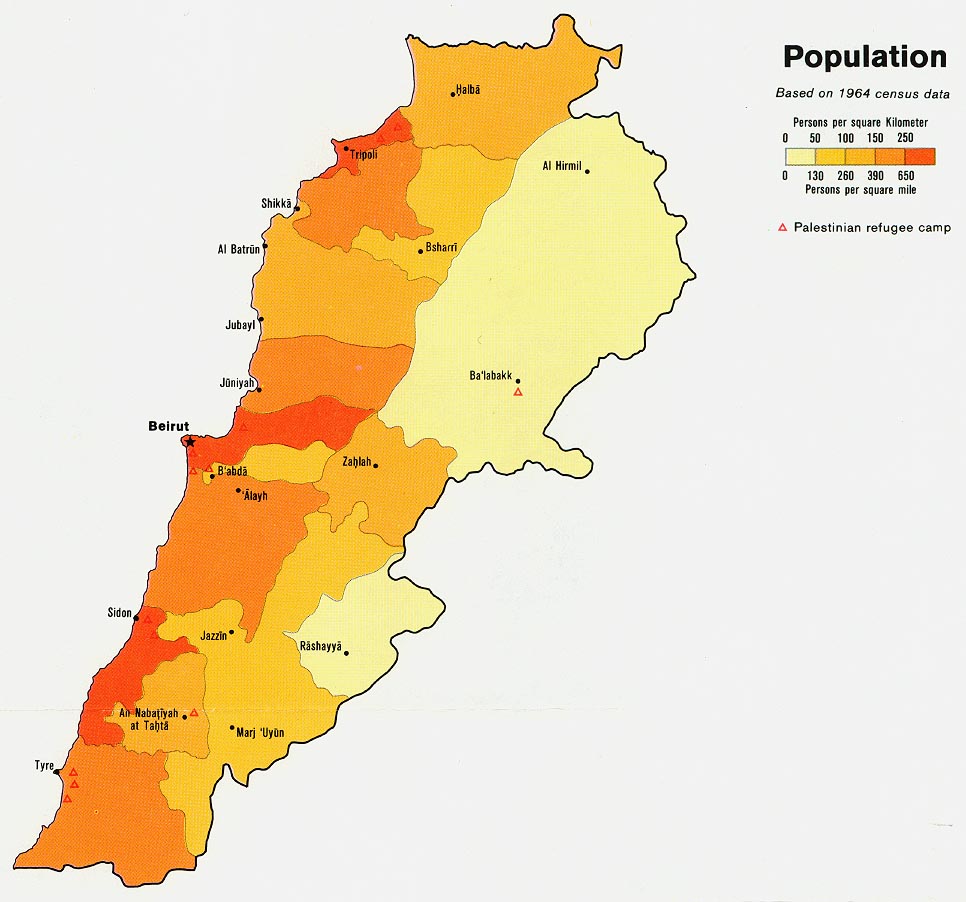
- Lebanon - Population from Map No. 503804 1979 (153K)
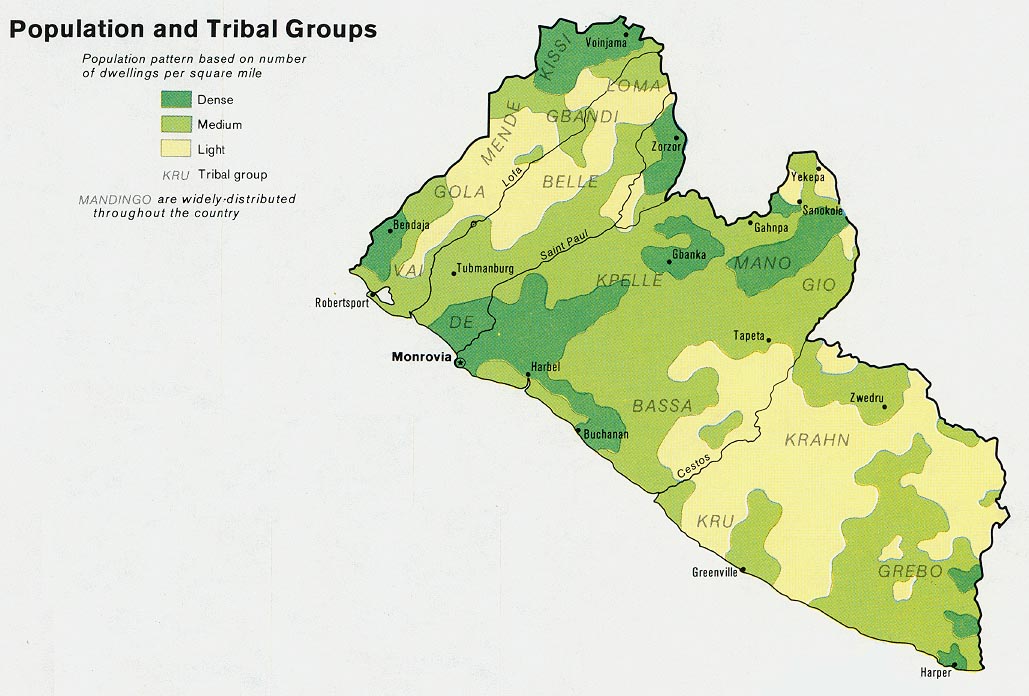
- Liberia - Population and Tribal Groups from Map No. 501556 1973 (132K)
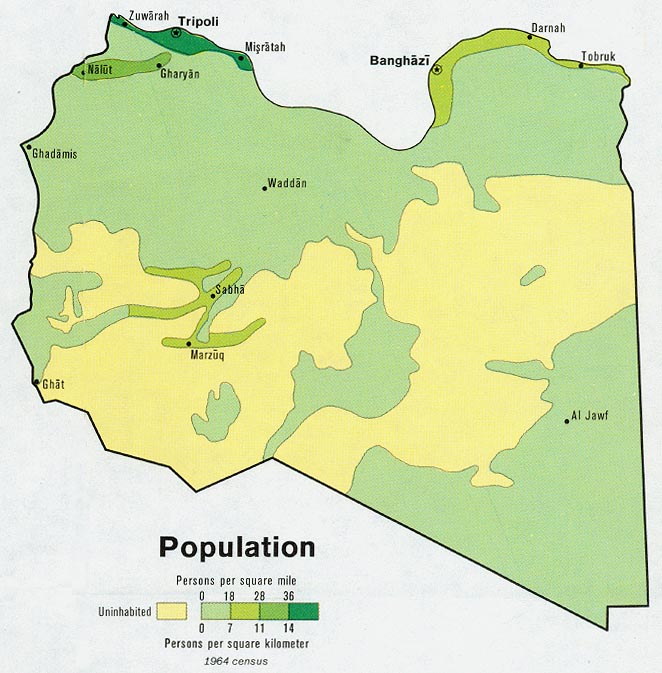
- Libya - Population from Map No. 501564 1974 (106K)
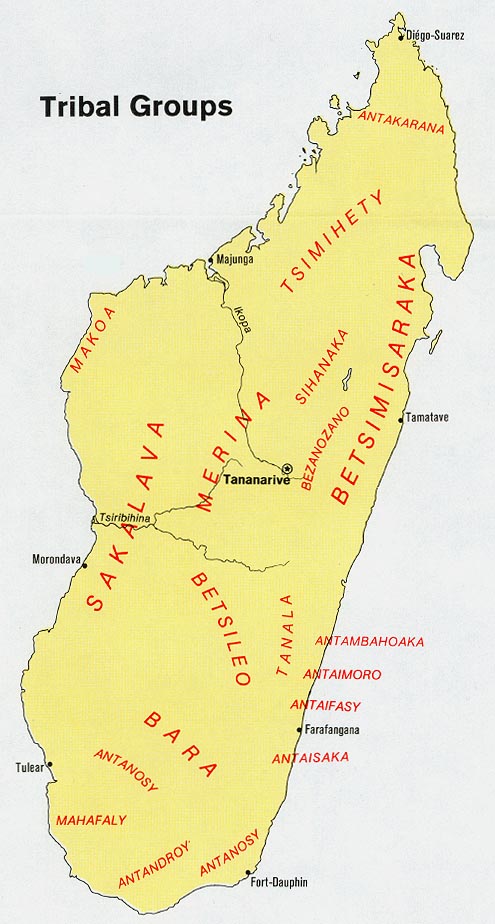
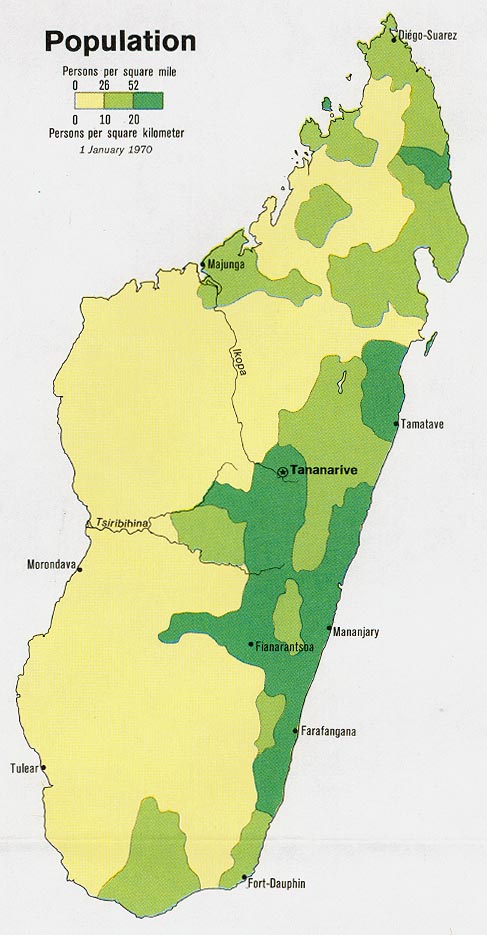
- Madagascar - Population 1973 (97K)
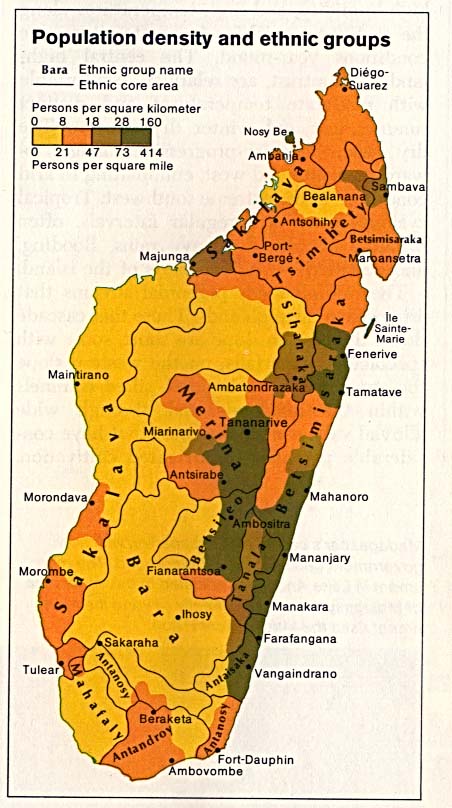
- Madagascar - Population Density and Ethnic Groups from The Indian Ocean Atlas 1976 (80K)
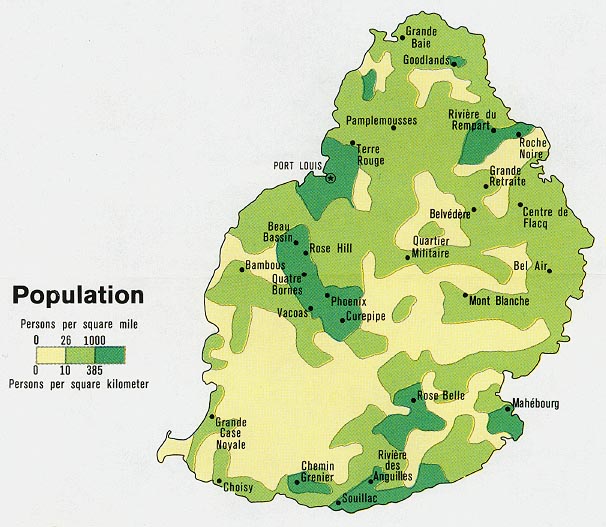
- Mauritius - Population 1972 (98K)
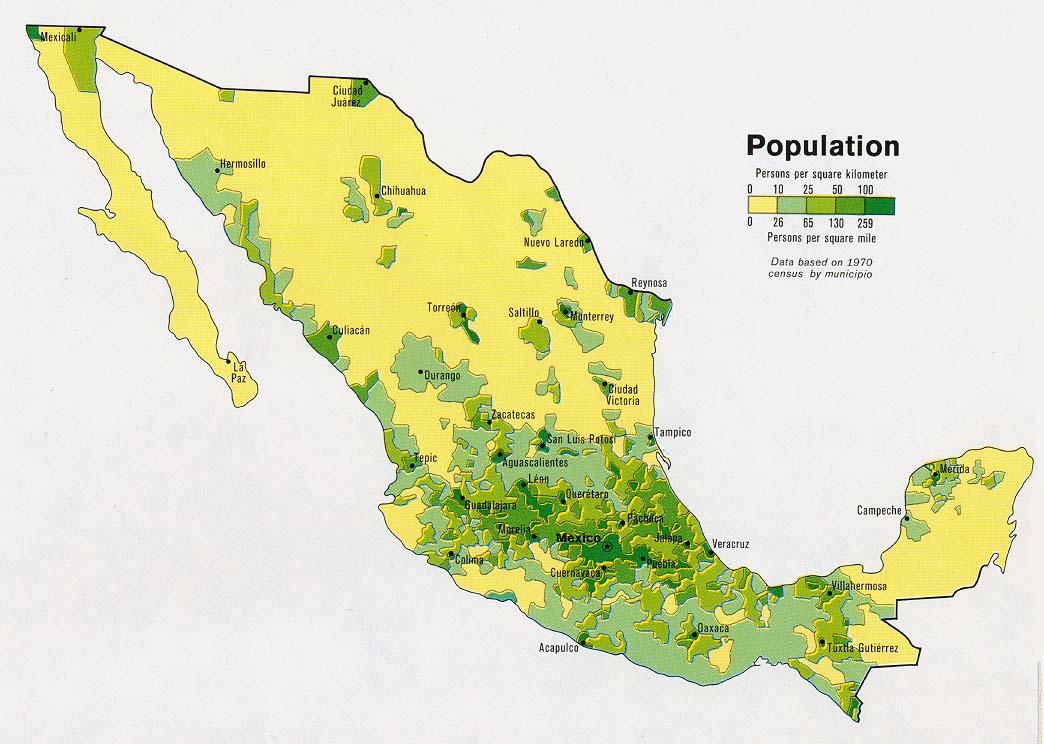
- Mexico - Population from Map No. 503497 1978 (131K)
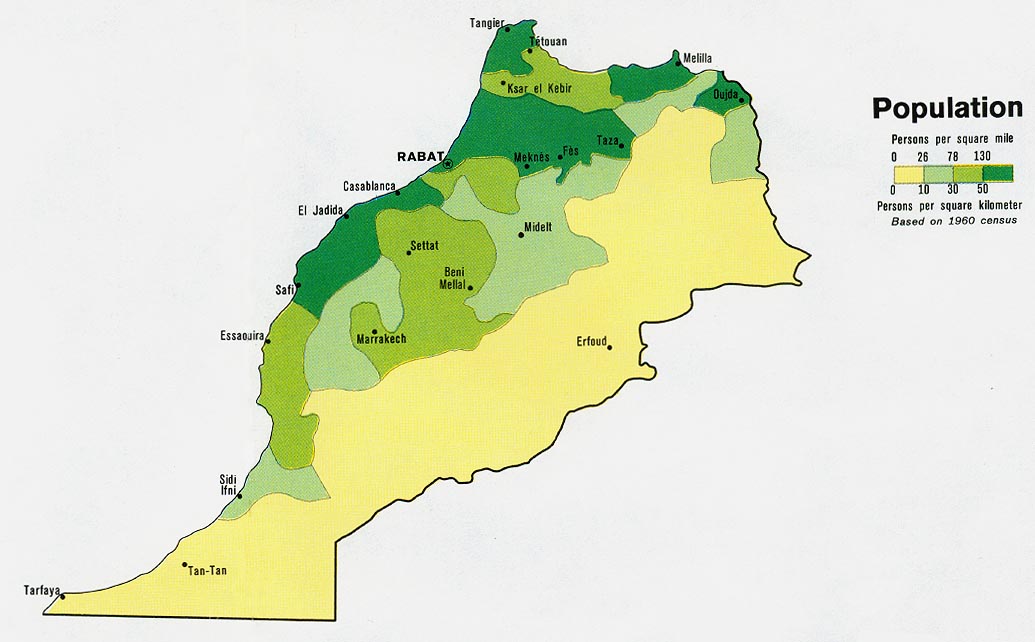
- Morocco - Population from Map No. 500977 1973 (95K)
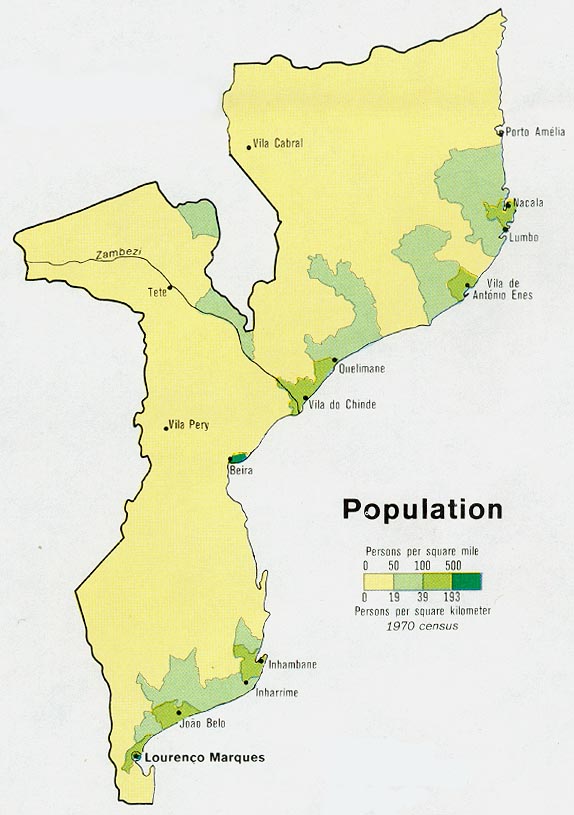
- Mozambique - Population from Map No. 501370 1973 (82K)
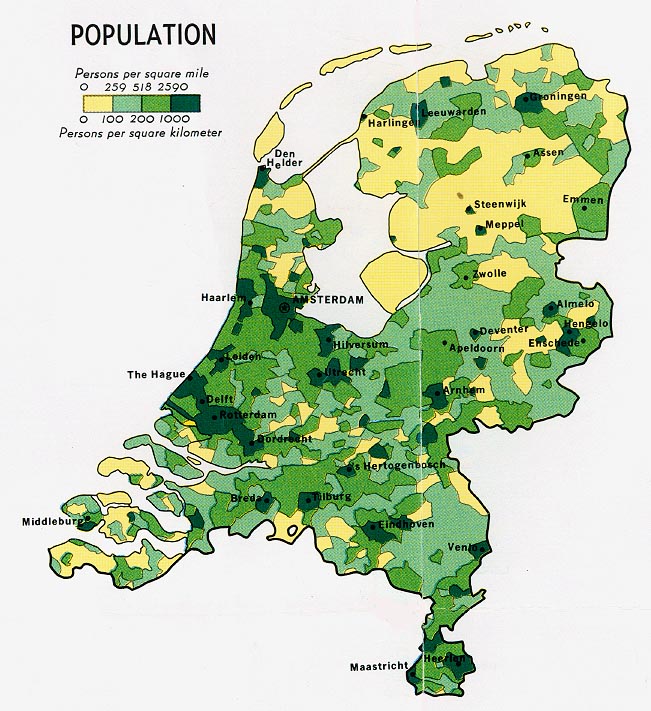
- Netherlands - Population from Map No. 76863 1970 (153K)
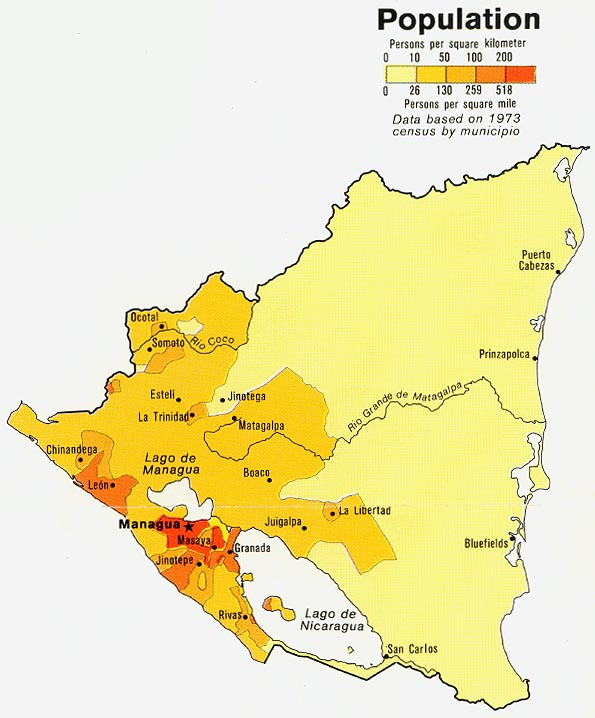
- Nicaragua - Population from Map No. 504012 1979 (93K)
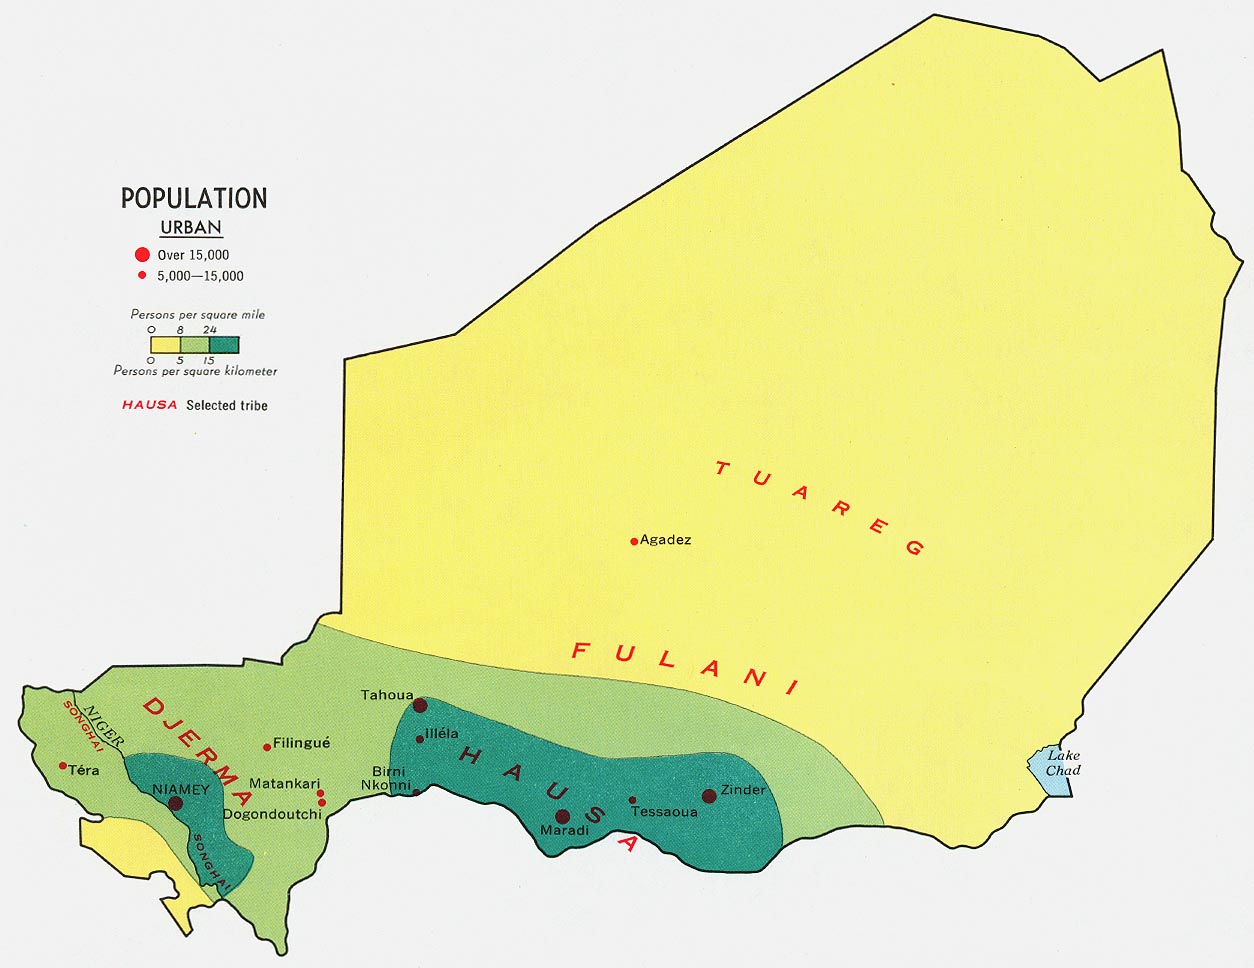
- Niger - Population from Map No. 59203 1969 (138K)
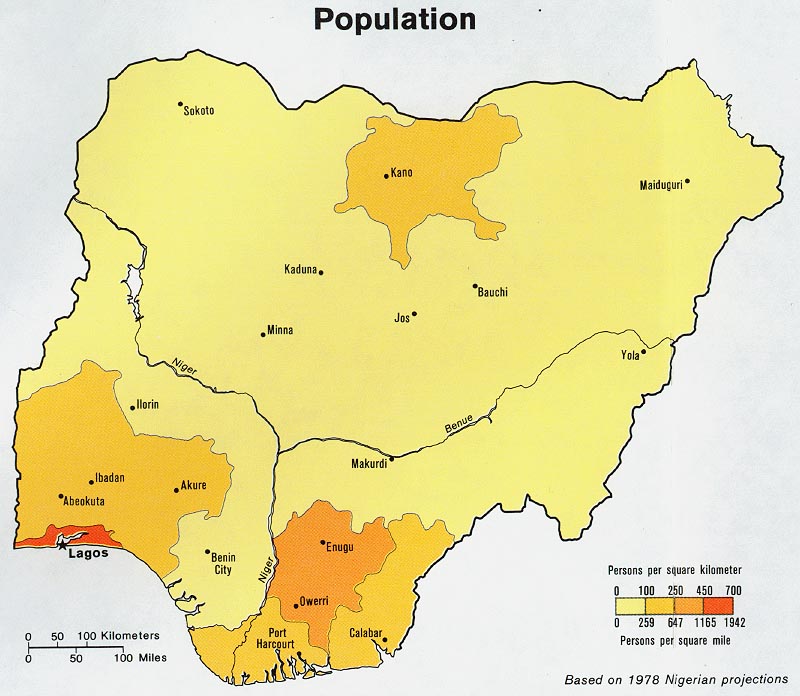
- Nigeria - Population from Map No. 504014 1979 (112K)
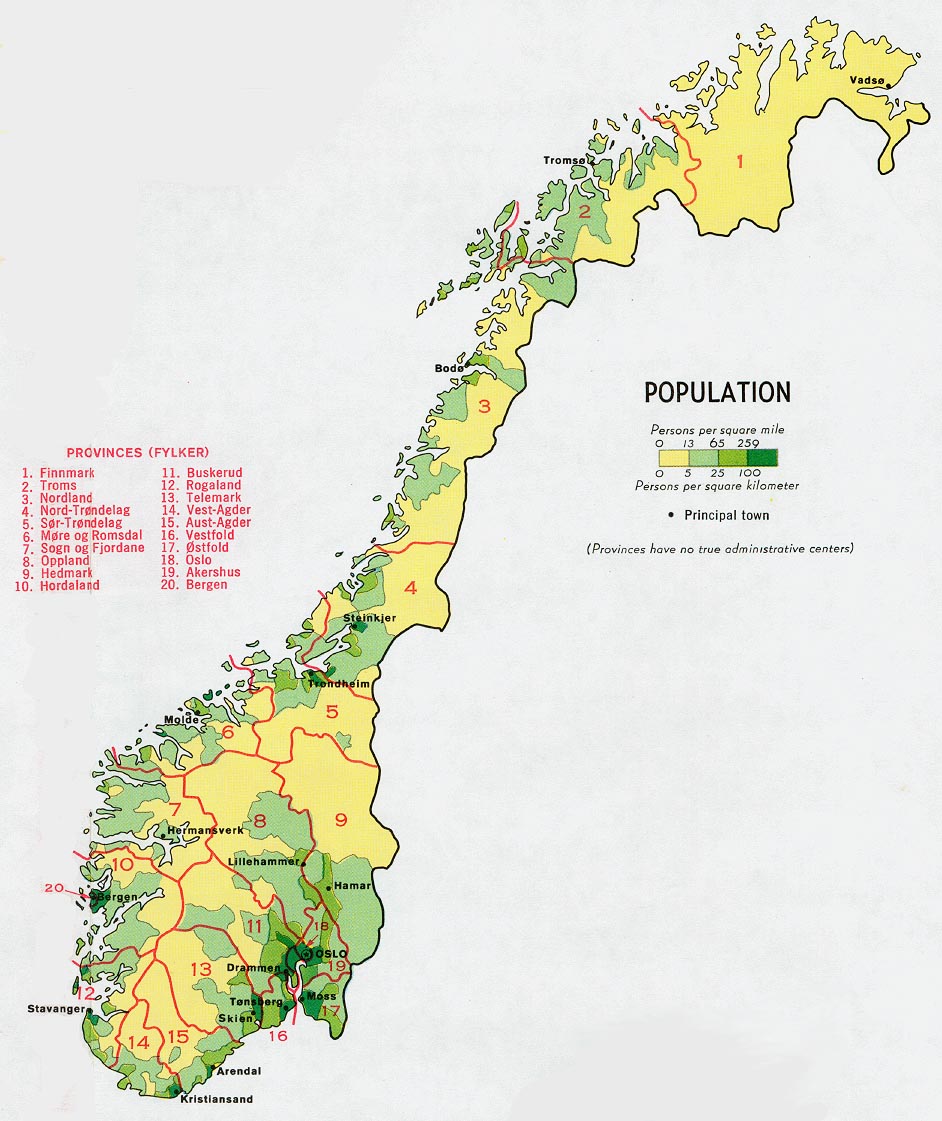
- Norway - Population from Map No. 500007 1971 (190K)
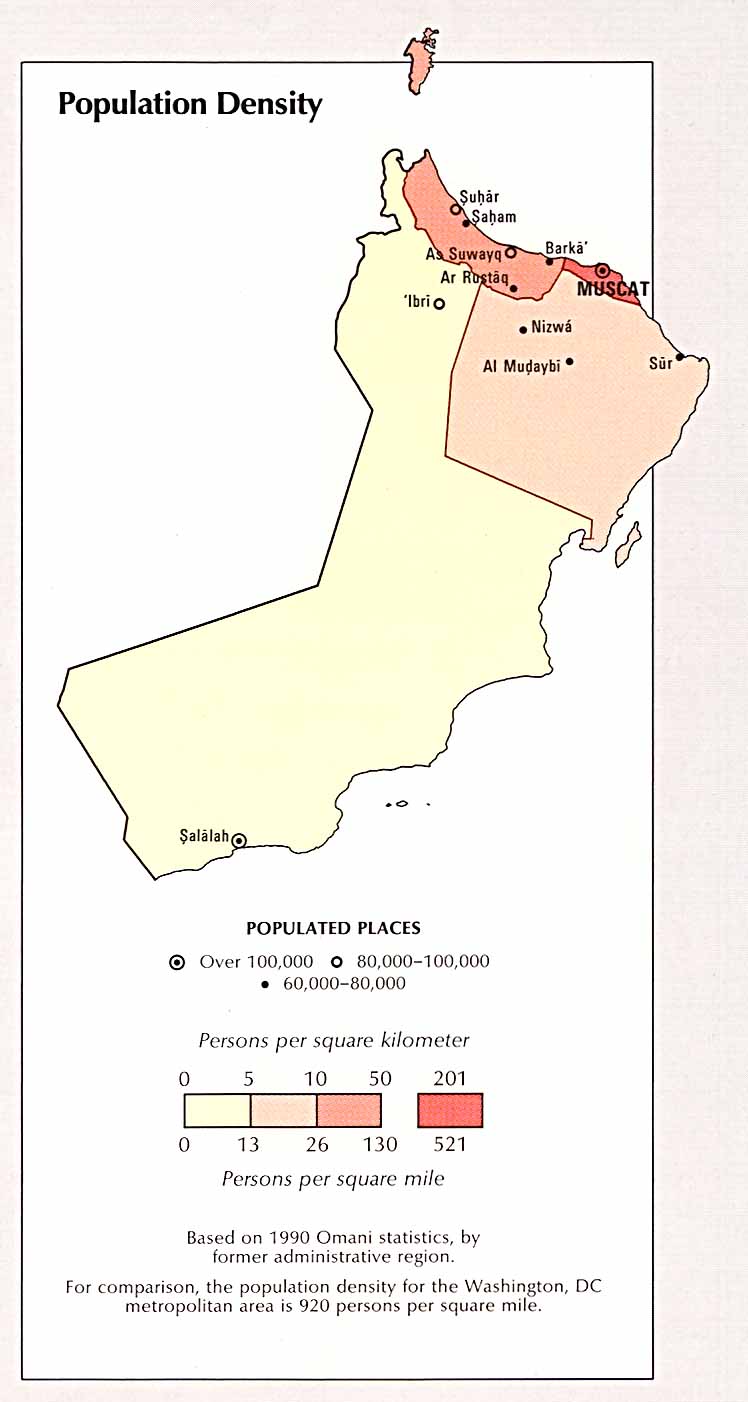
- Oman - Population Density from the CIA Atlas of the Middle East 1993 (73K)
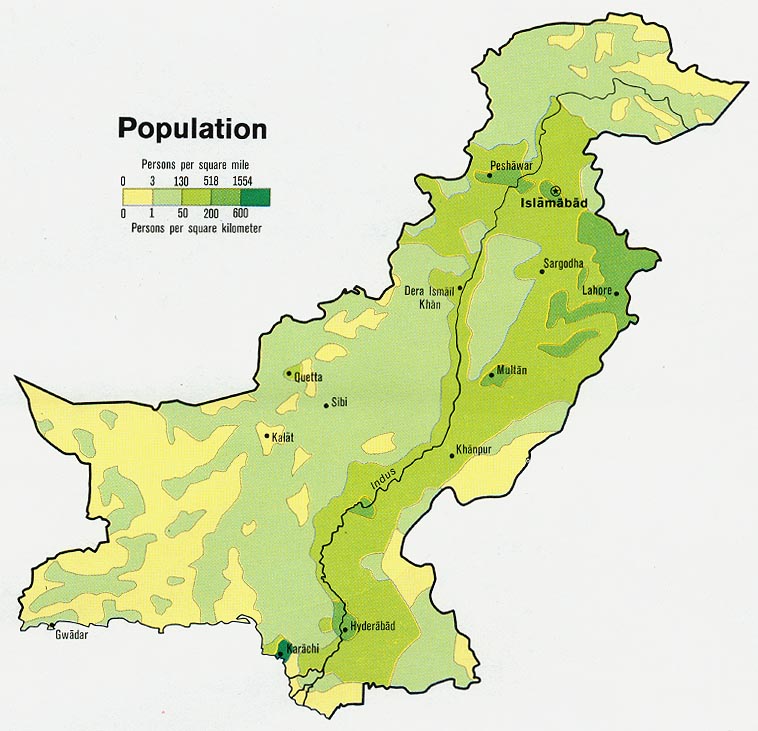
- Pakistan - Population from Map No. 501383 1973 (112K)
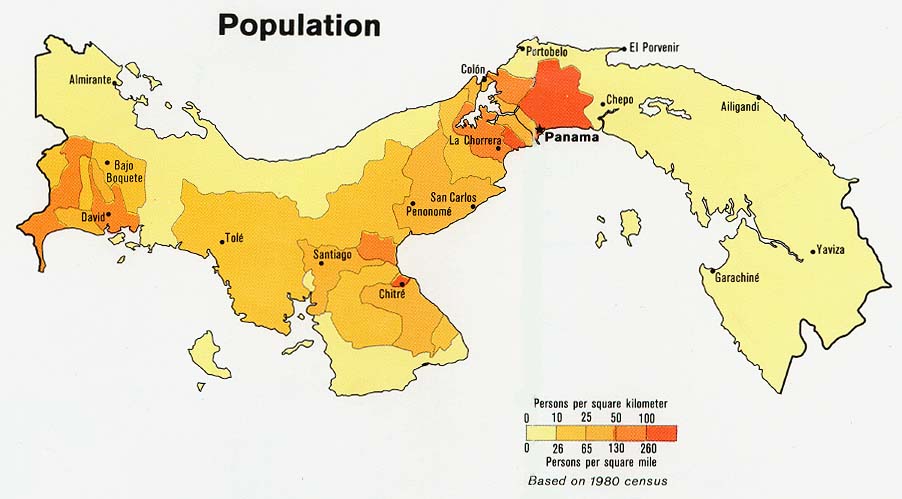
- Panama - Population from Map No. 545665 1981 (82K)
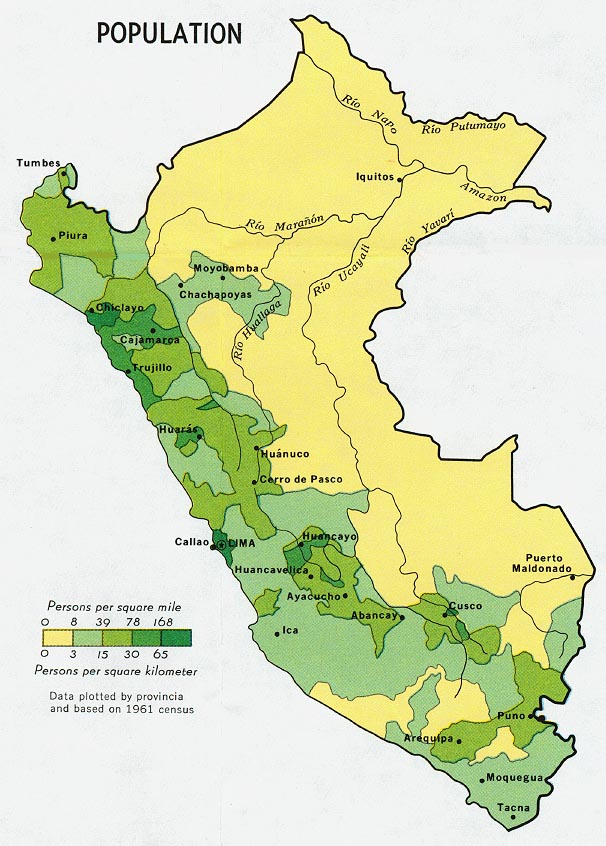
- Peru - Population from Map No. 76868 1970 (132K)
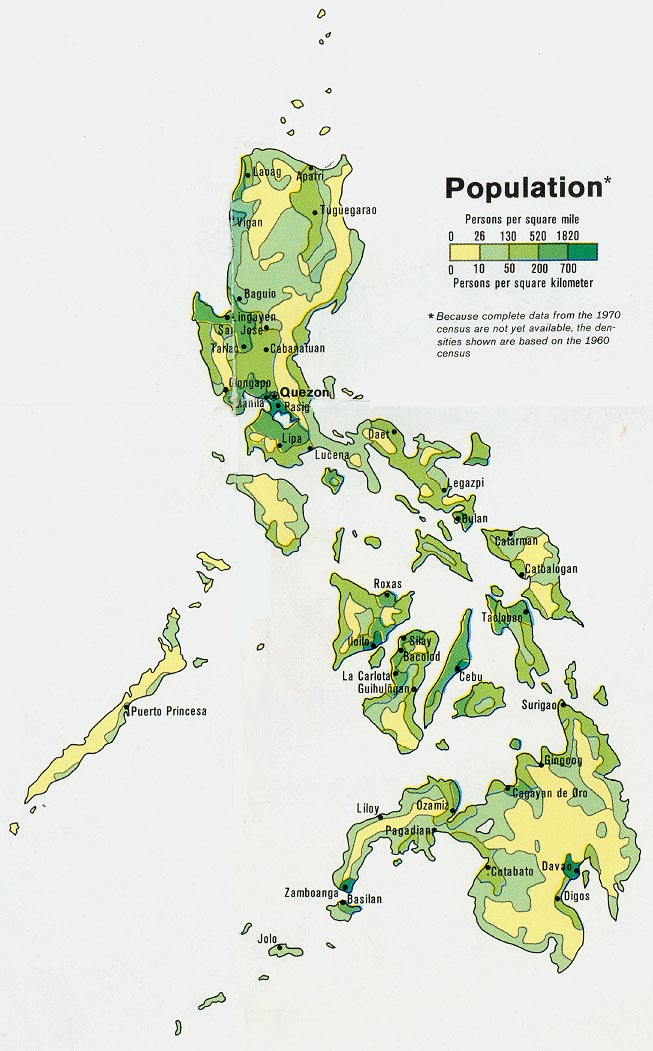
- Philippines - Population from Map No. 501475 1973 (140K)
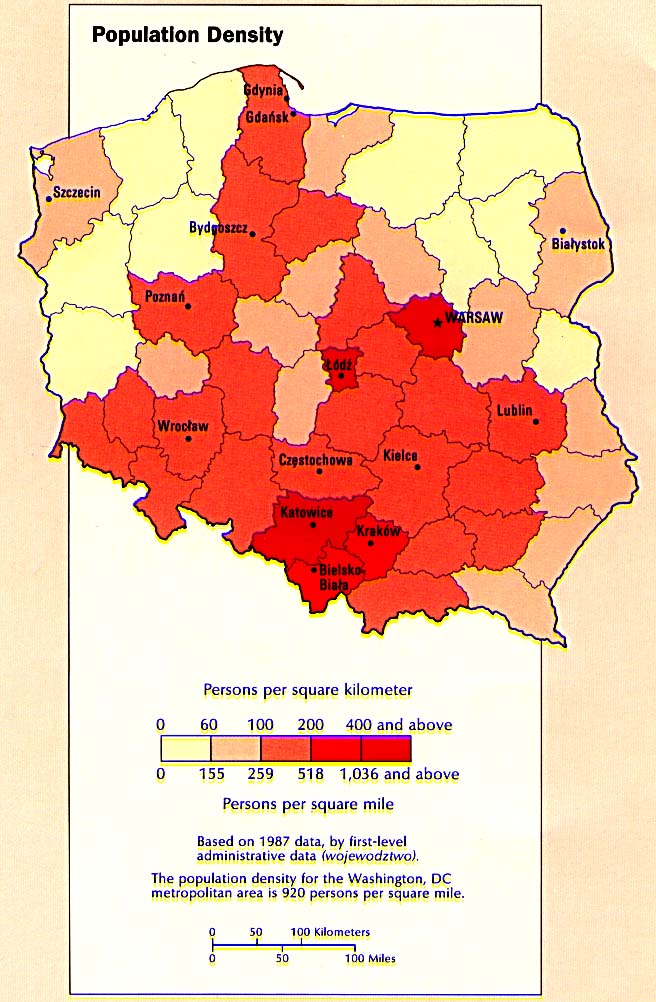
- Poland - Population Density from the CIA Atlas of the Eastern Europe 1990 (123K)
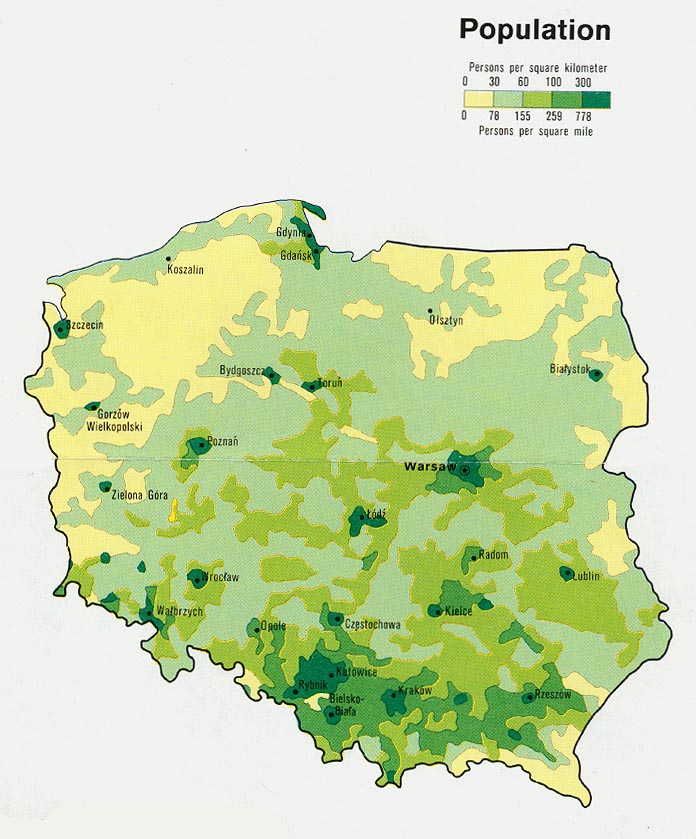
- Poland - Population from Map No. 503478 1977 (141K)
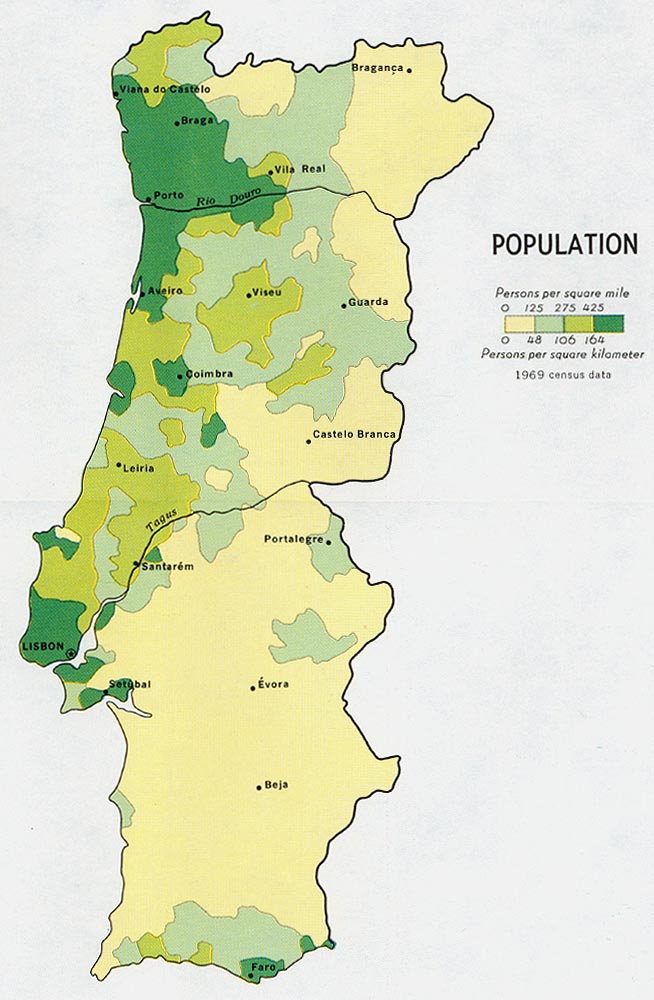
- Portugal - Population from Map No. 500530 1972 (192K)
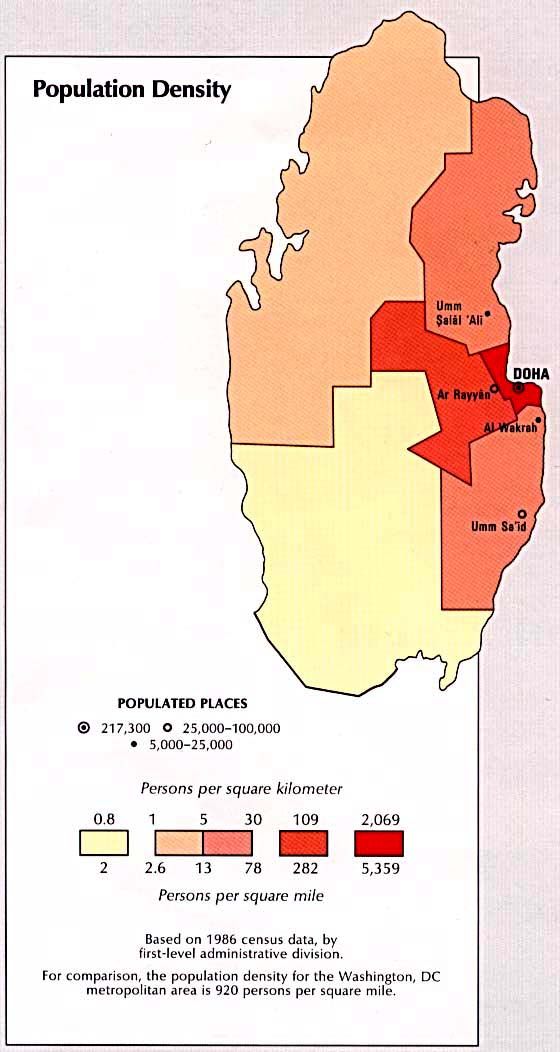
- Qatar - Population Density from the CIA Atlas of the Middle East 1993 (69K)
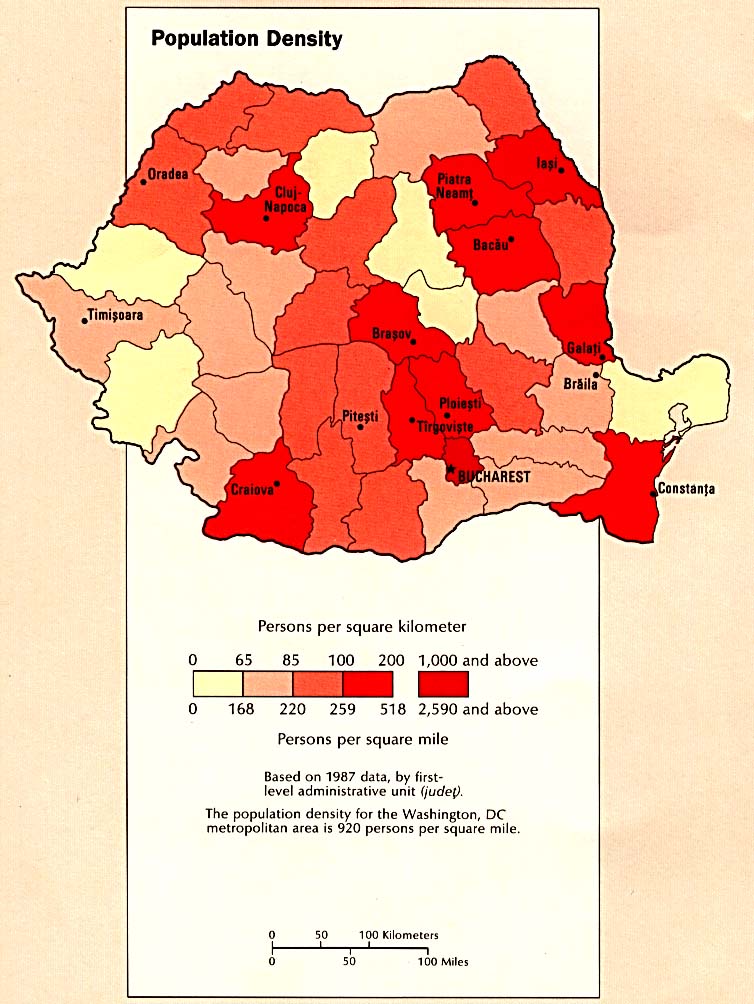
- Romania - Population Density from the CIA Atlas of Eastern Europe 1990 (116K)
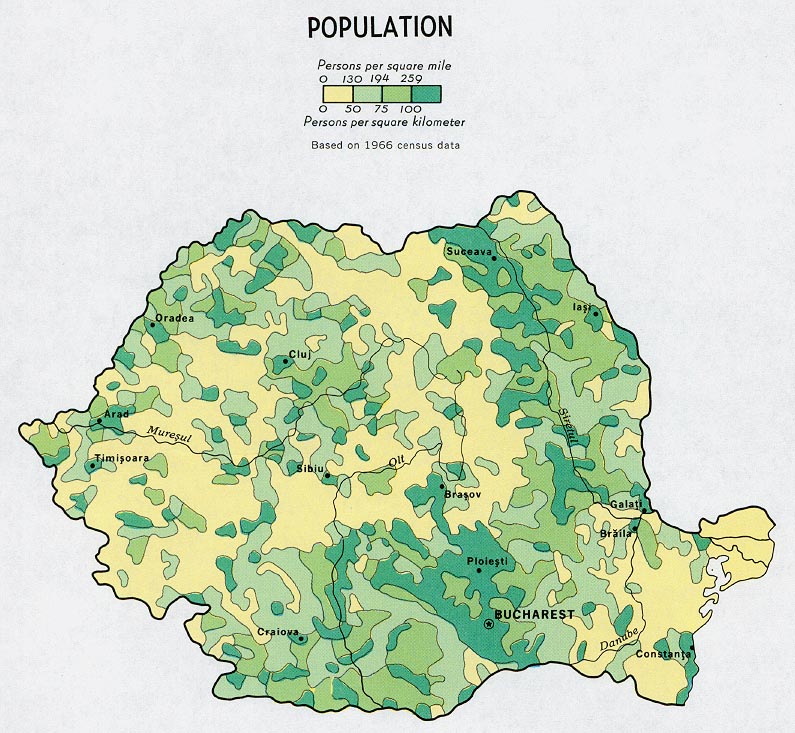
- Romania - Population from Map No. 76858 1970 (180K)
- [Russia] Soviet Union - Population from Map No. 501614 1974 (263K)
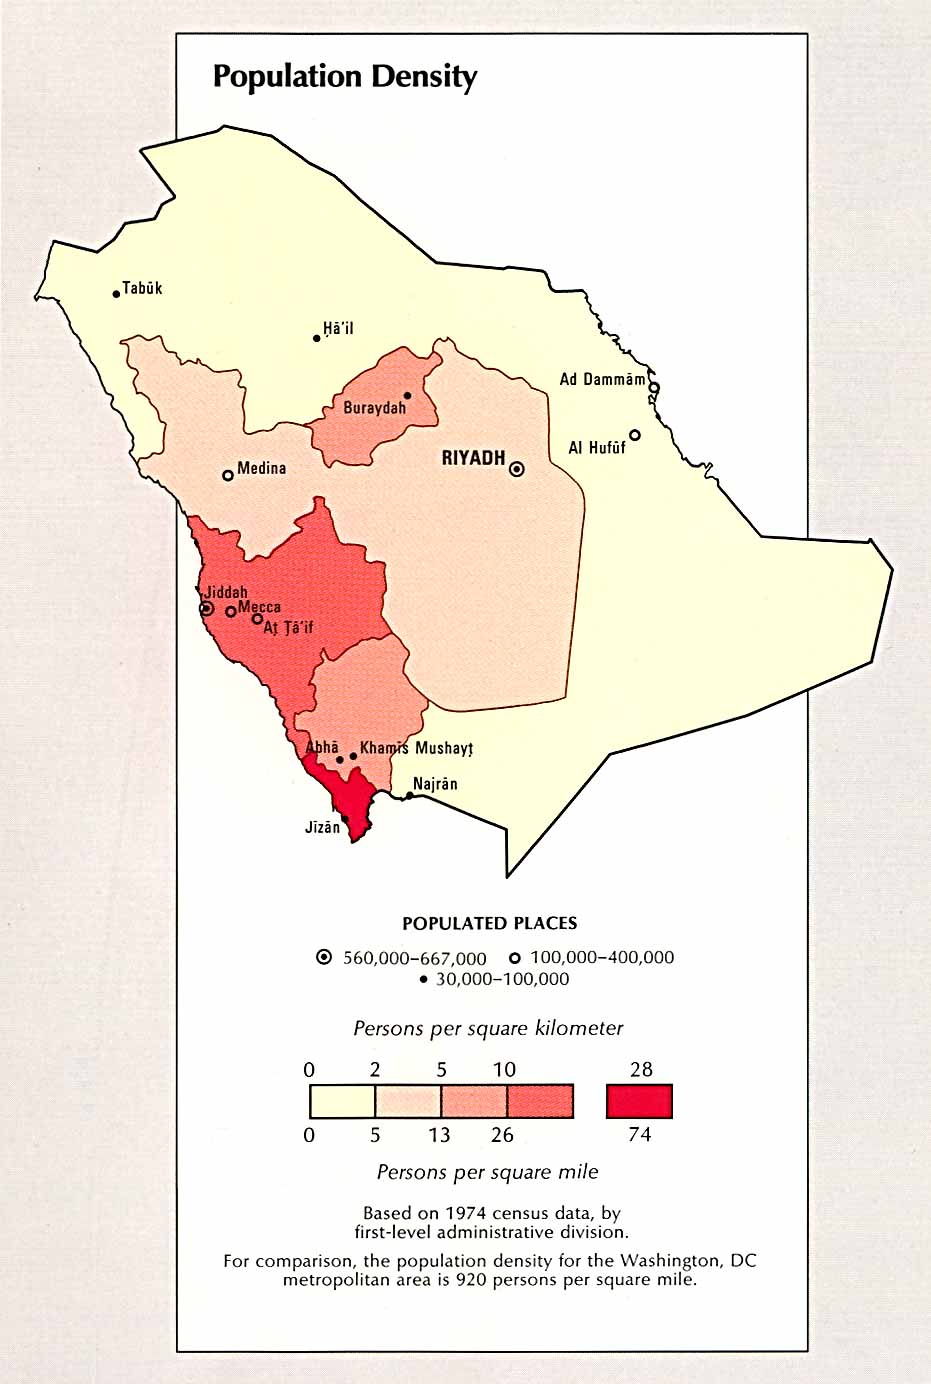
- Saudi Arabia - Population Density from the CIA Atlas of the Middle East 1993 (103K)
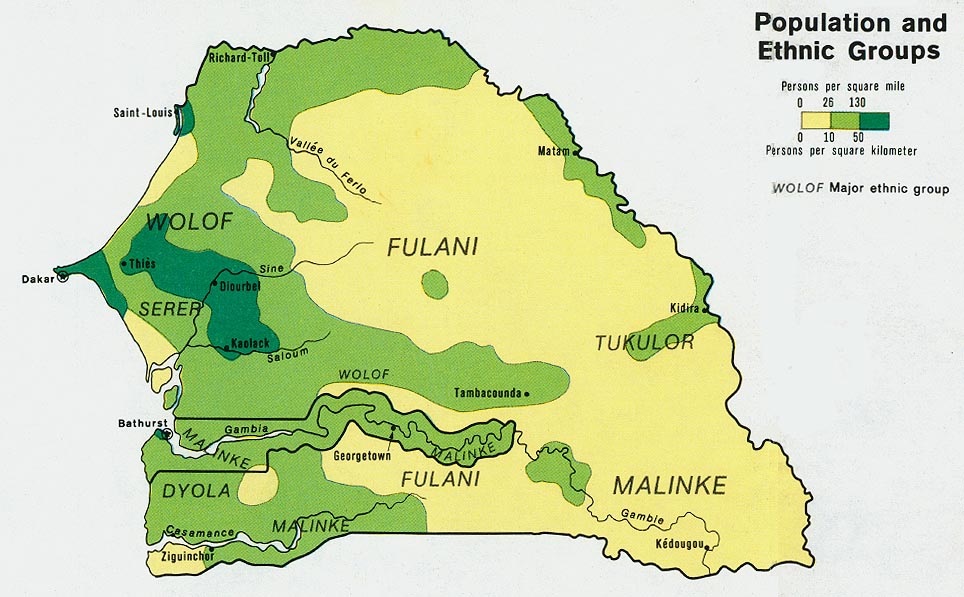
- Senegal and Gambia - Population from Map No. 500708 1972 (134K)
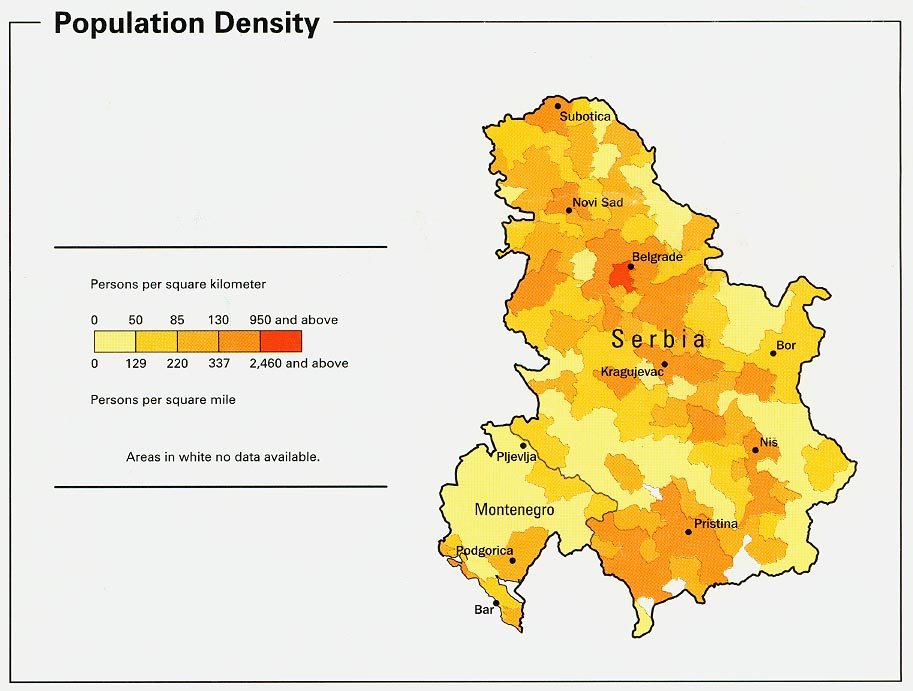
- Serbia and Montenegro - Population Density from Map No. 802165 1993 (115K)
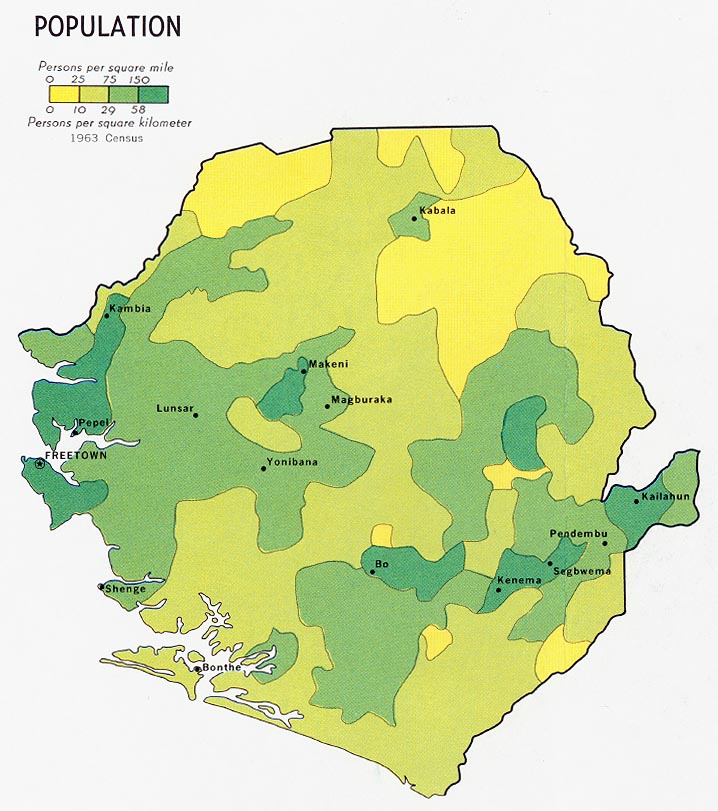
- Sierra Leone - Population from Map No. 58962 1969 (133K)
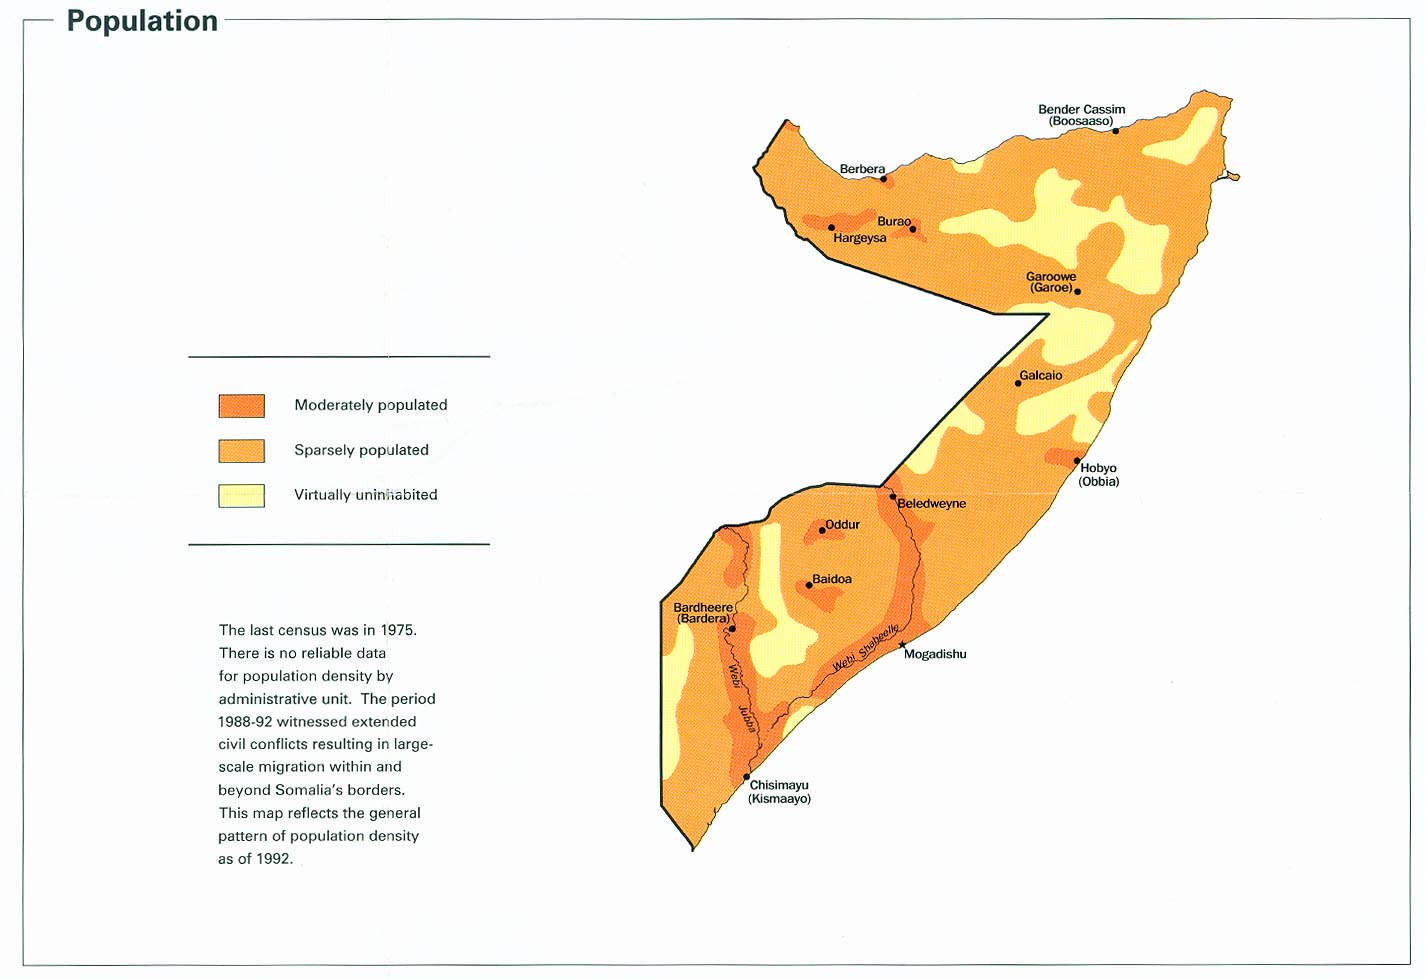
- Somalia - Population from Map No. 802858 2002 (82K)
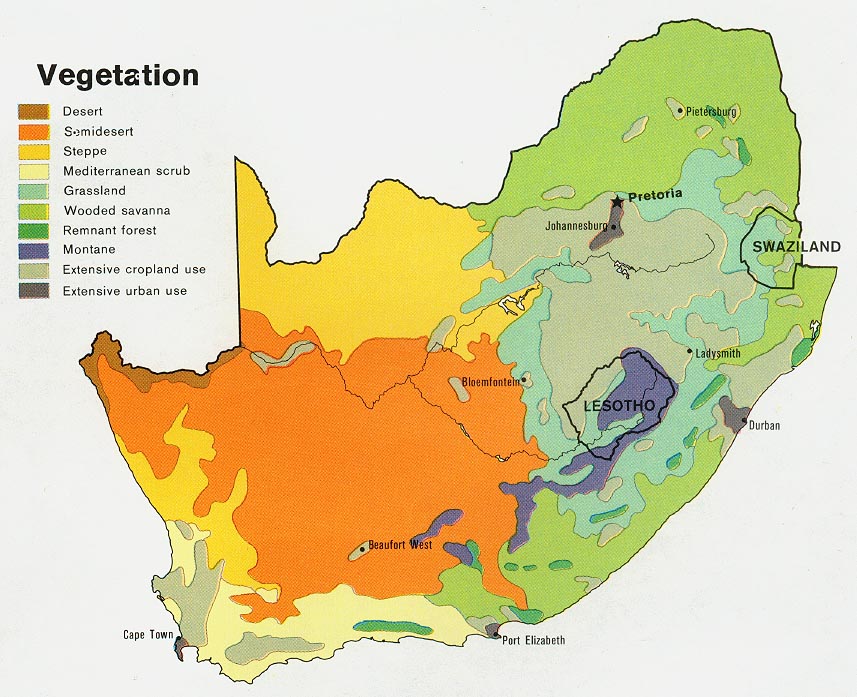
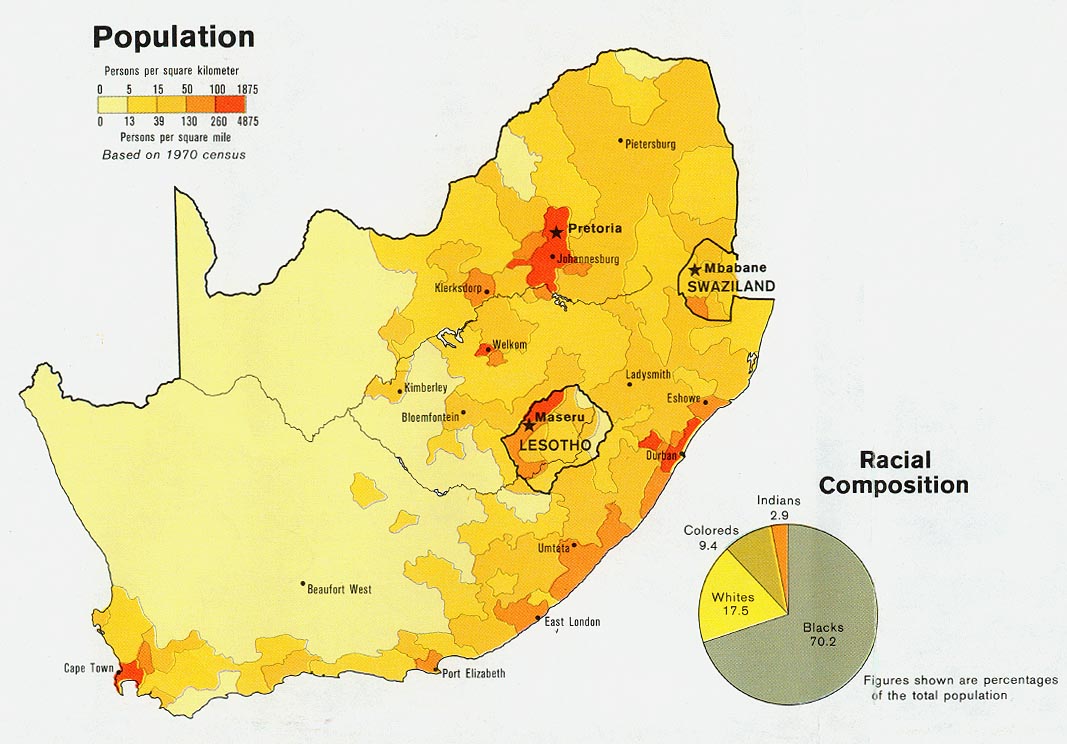
- South Africa - Population from Map No. 503971 1979 (140K)
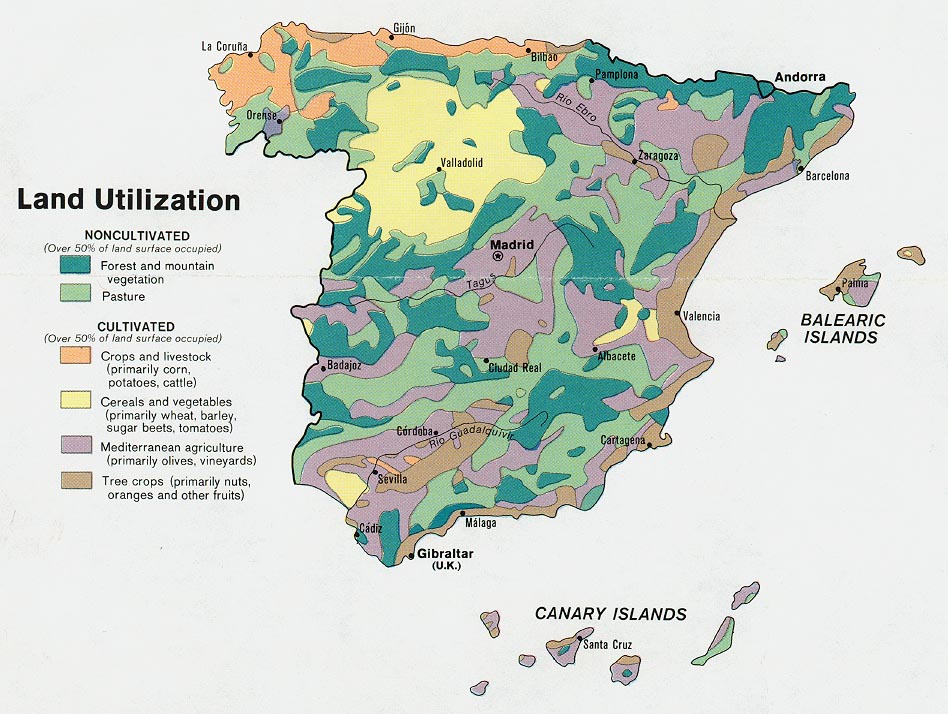
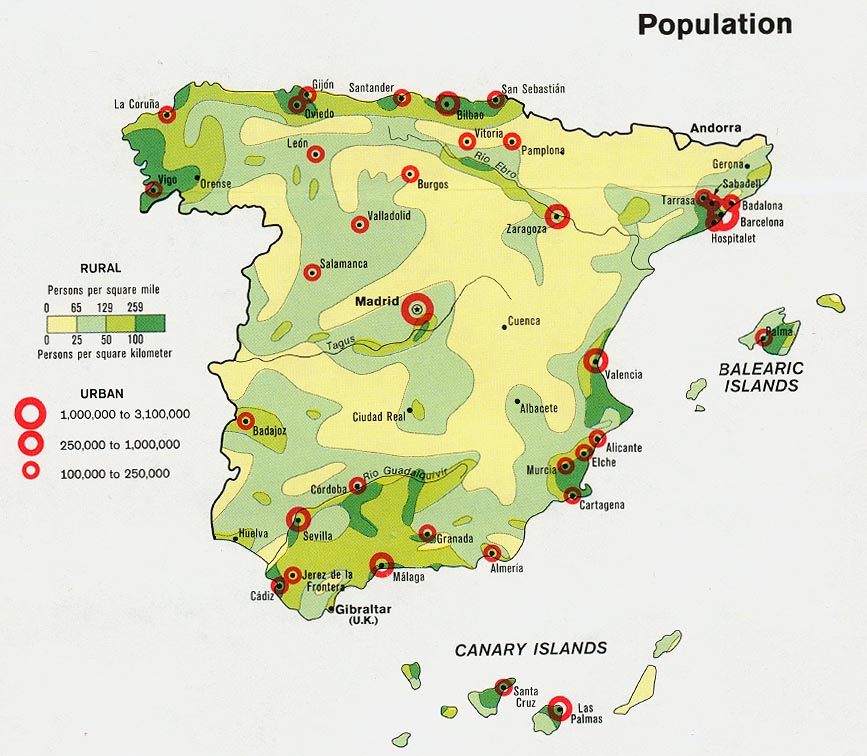
- Spain - Population from Map No. 501745 1974 (146K)
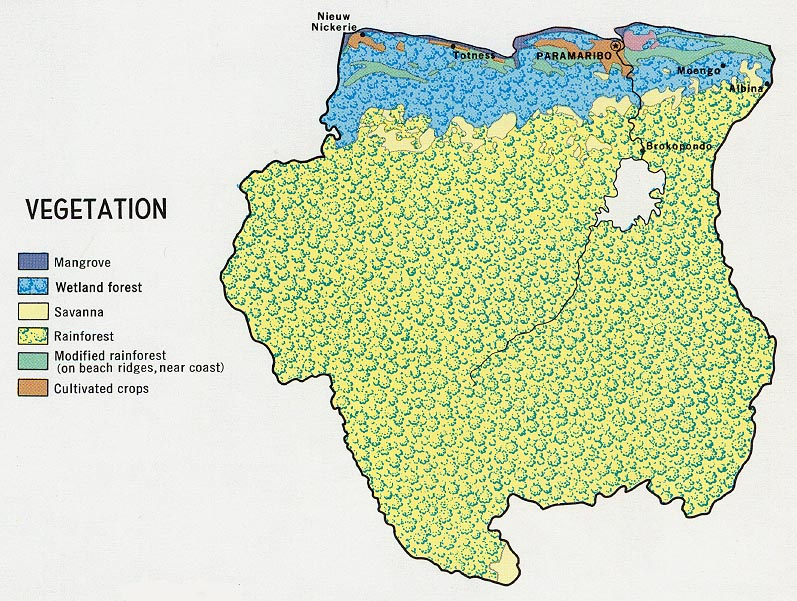
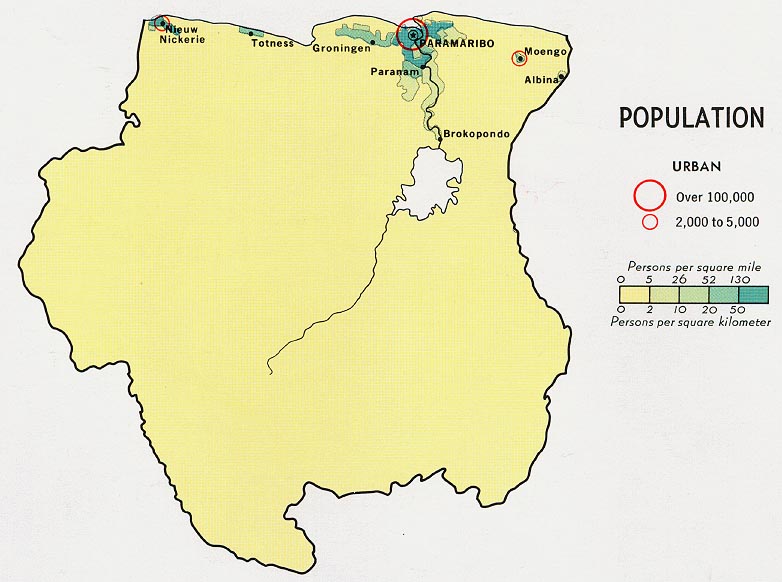
- Suriname - Population from Map No. 56828 1968 (83K)
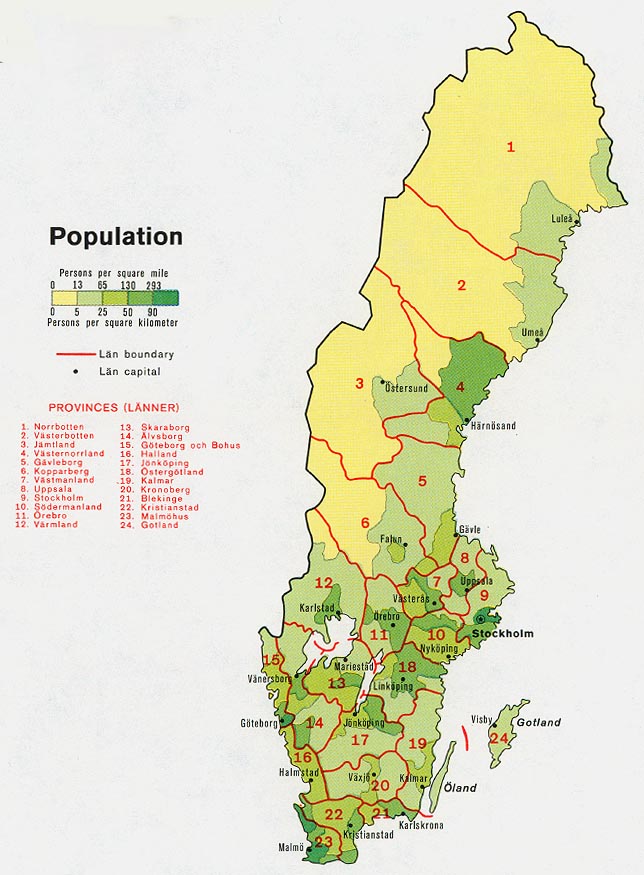
- Sweden - Population from Map No. 500866 1973 (121K)
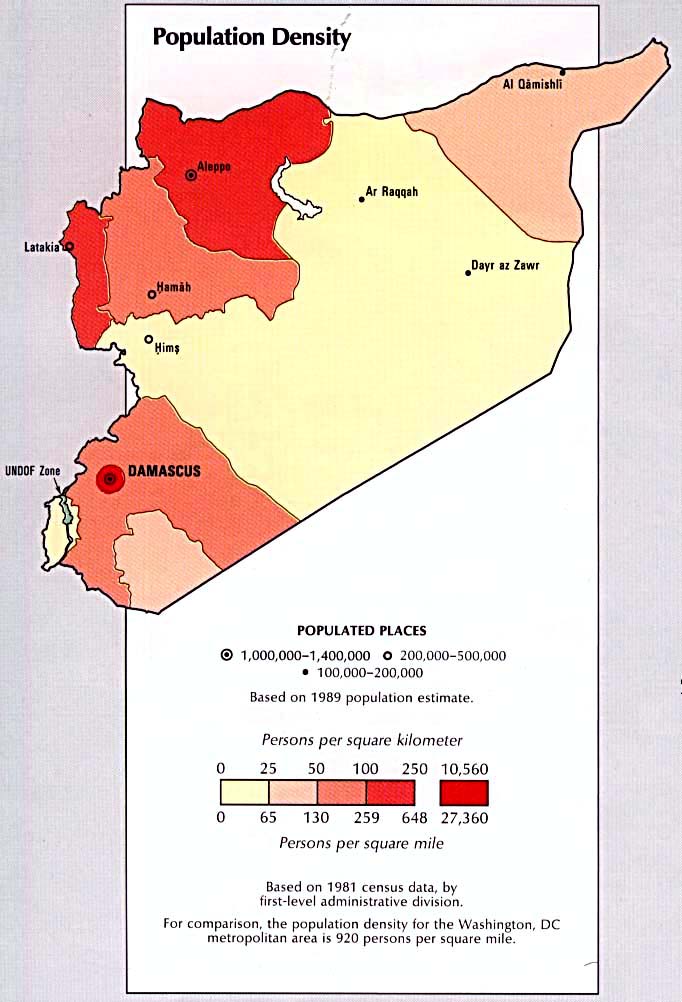
- Syria - Population Density from the CIA Atlas of the Middle East 1993 (86K)
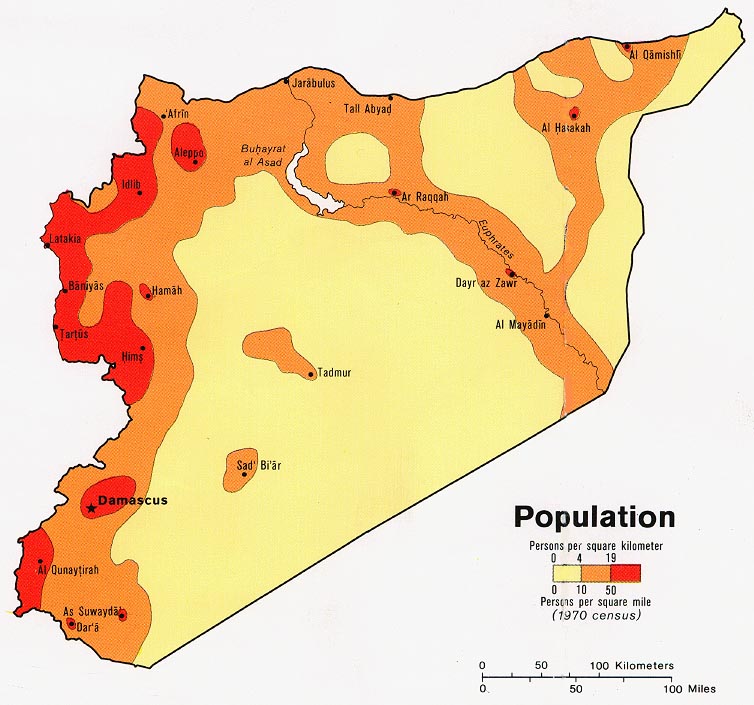
- Syria - Population from Map No. 503966 1979 (117K)
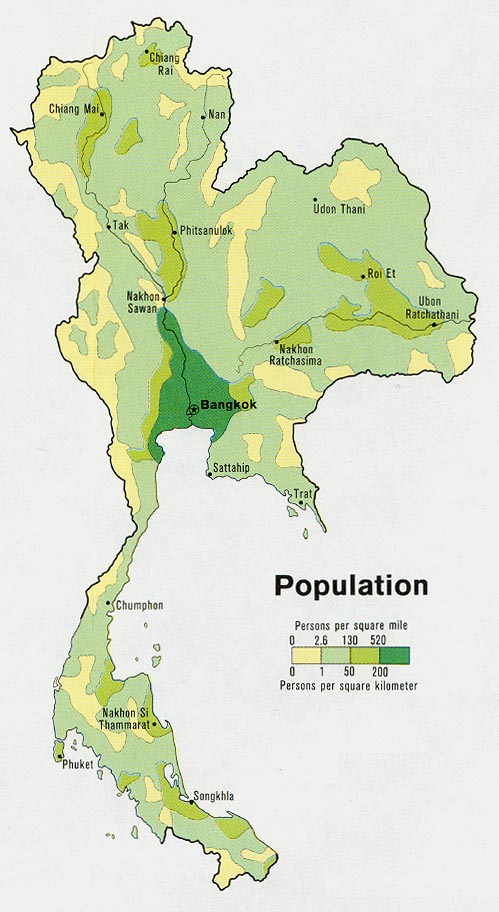
- Thailand - Population from Map No. 501551 1974 (104K)
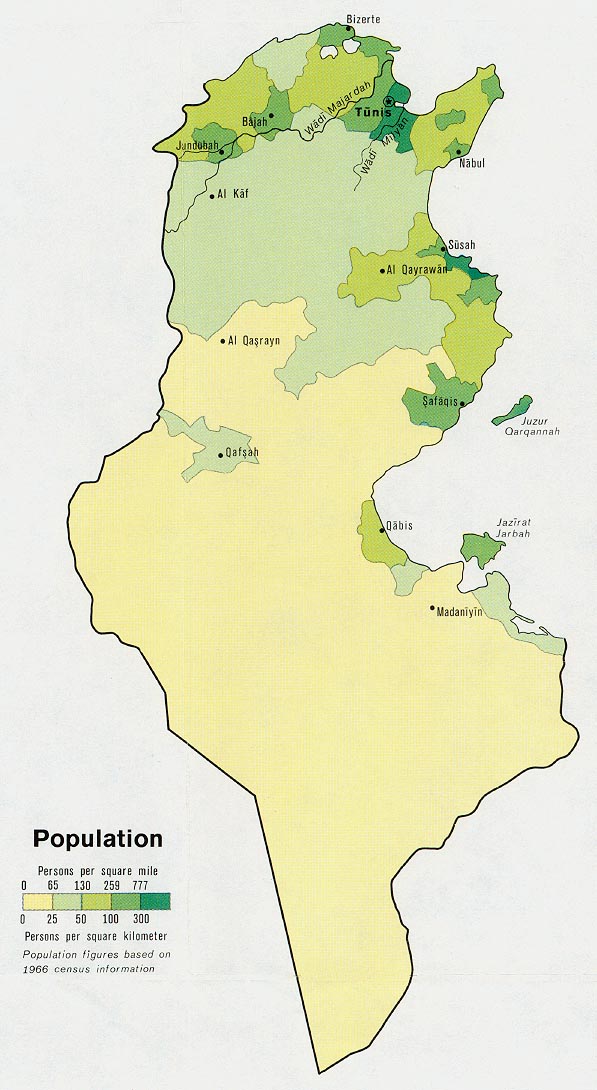
- Tunisia - Population from Map No. 500587 1972 (118K)
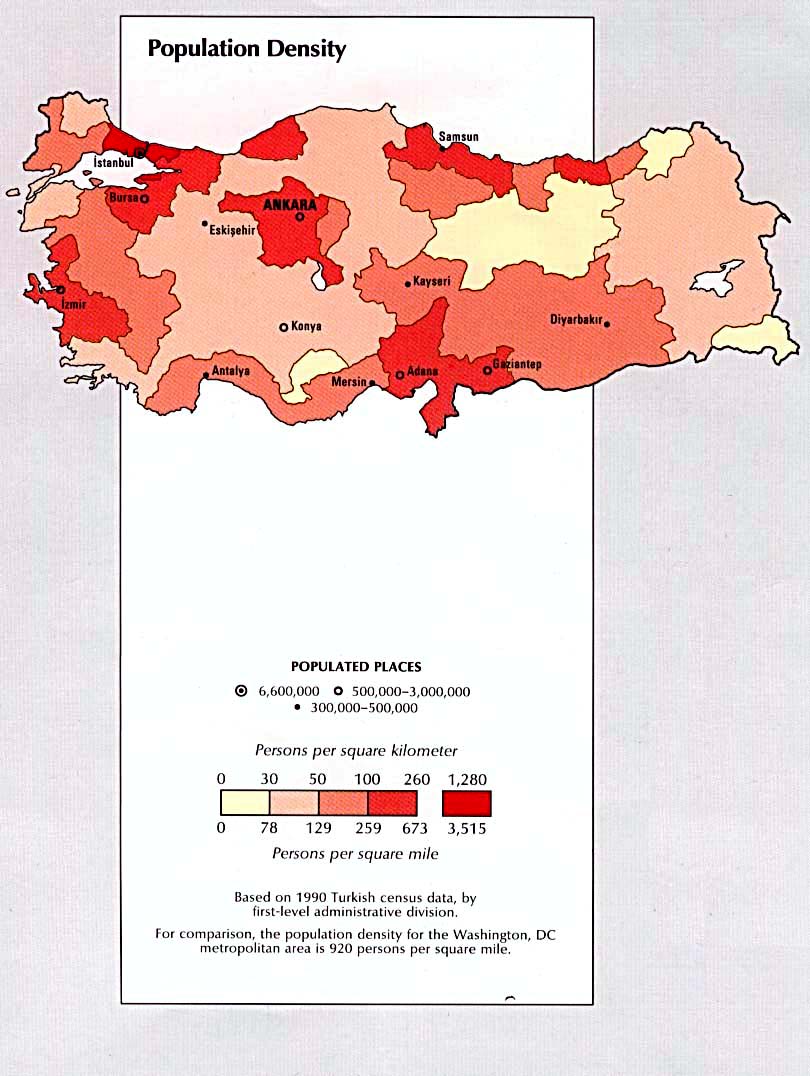
- Turkey - Population Density from Atlas of the Middle East 1993 (110K)
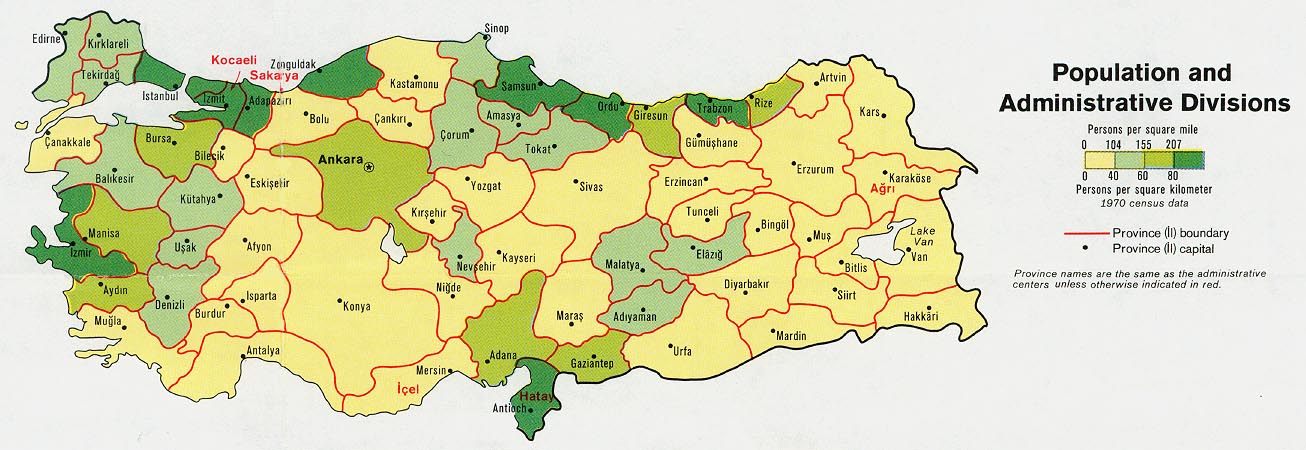
- Turkey - Population and Administrative Divisions from Map No. 501871 1974 (146K)
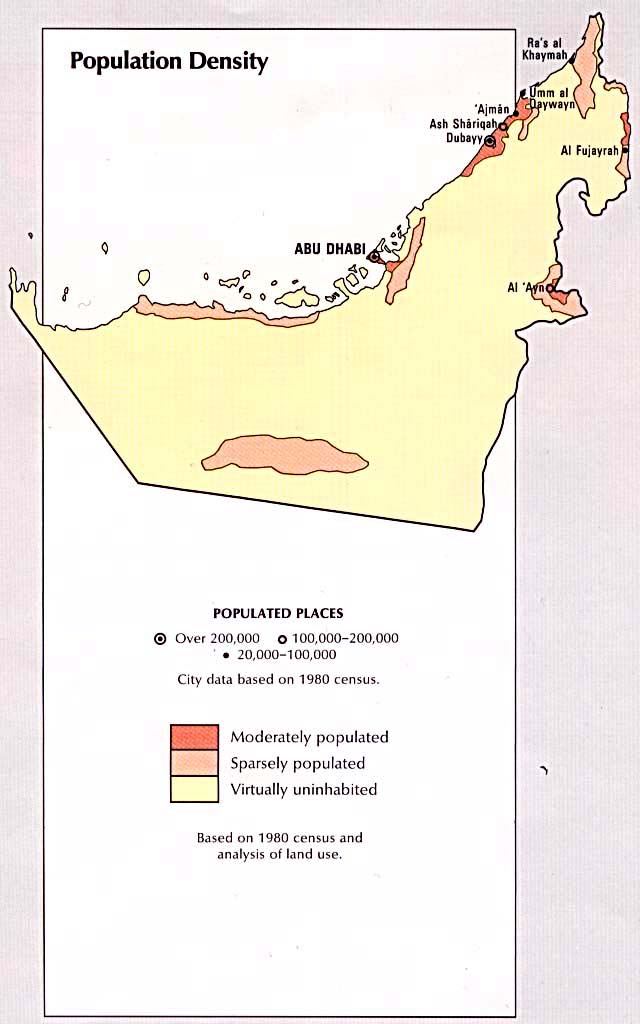
- United Arab Emirates - Population Density from the CIA Atlas of the Middle East 1993 (63K)
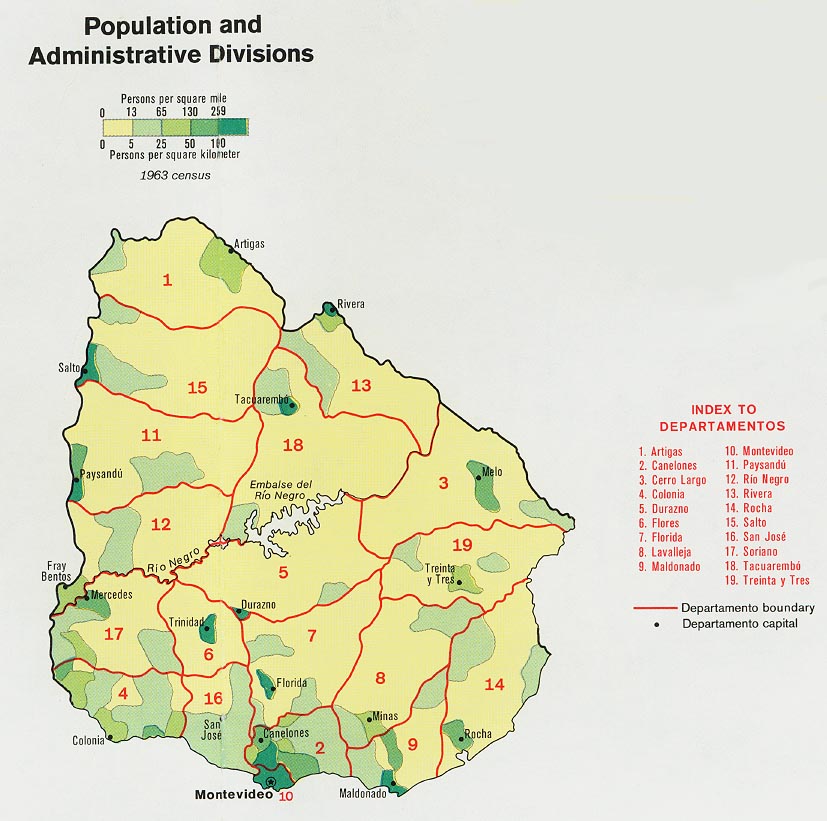
- Uruguay - Population and Administrative Divisions 1974 (135K)
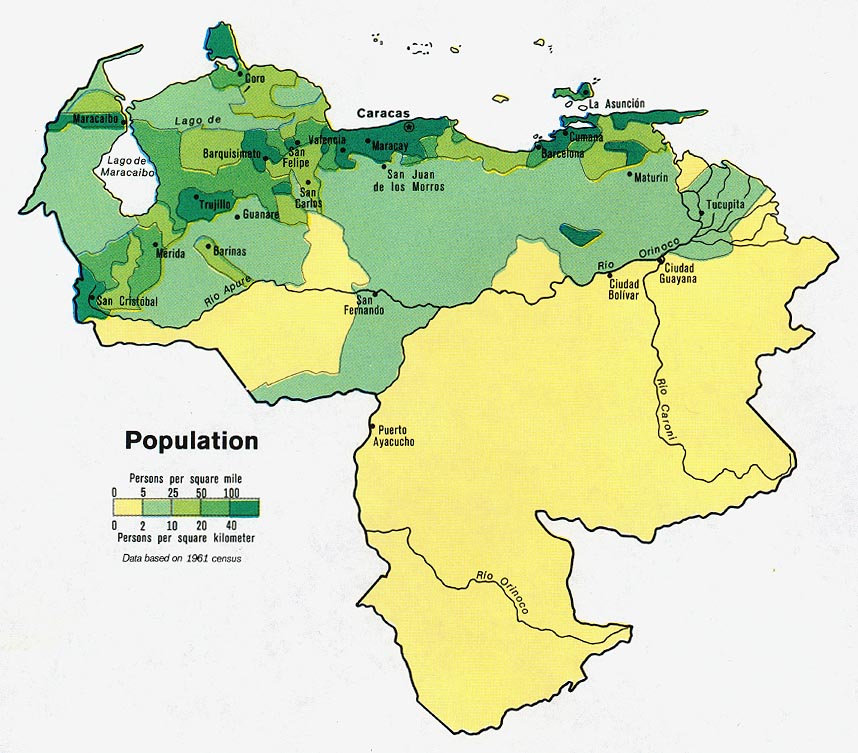
- Venezuela - Population from Map No. 500516 1972 (141K)
- Vietnam [South] - Population from Map No. 500874 1972 (146K)
- Yemen - Population Density from the CIA Atlas of the Middle East 1993(87K)
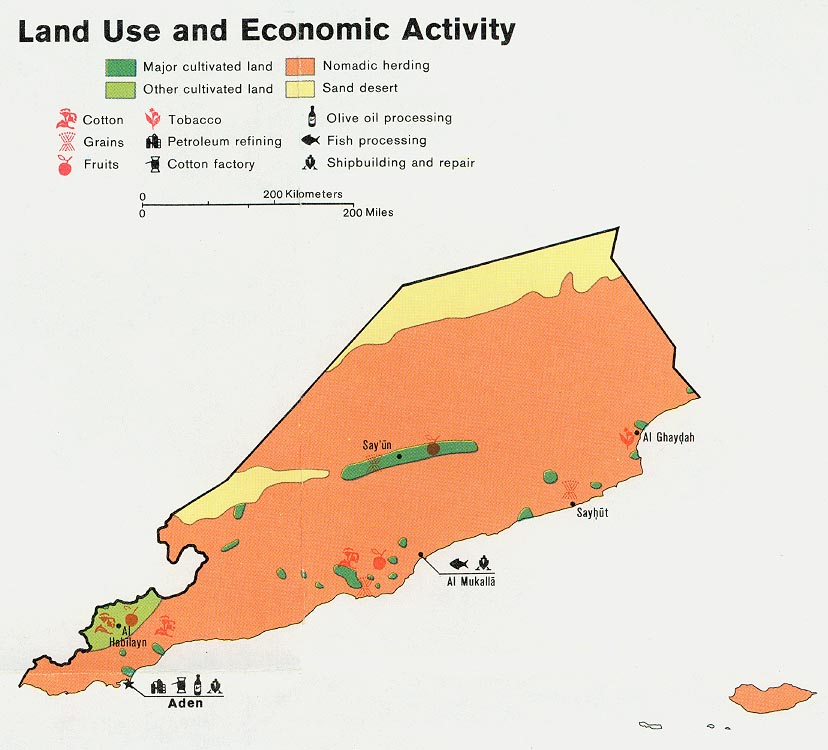
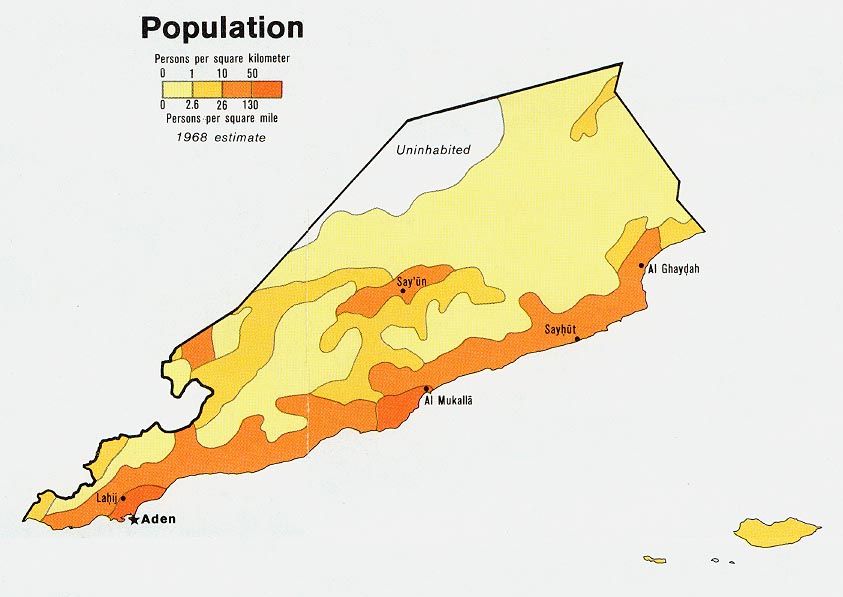
- Yemen - Southern - Population from Map No. 503858 1979 (81K)
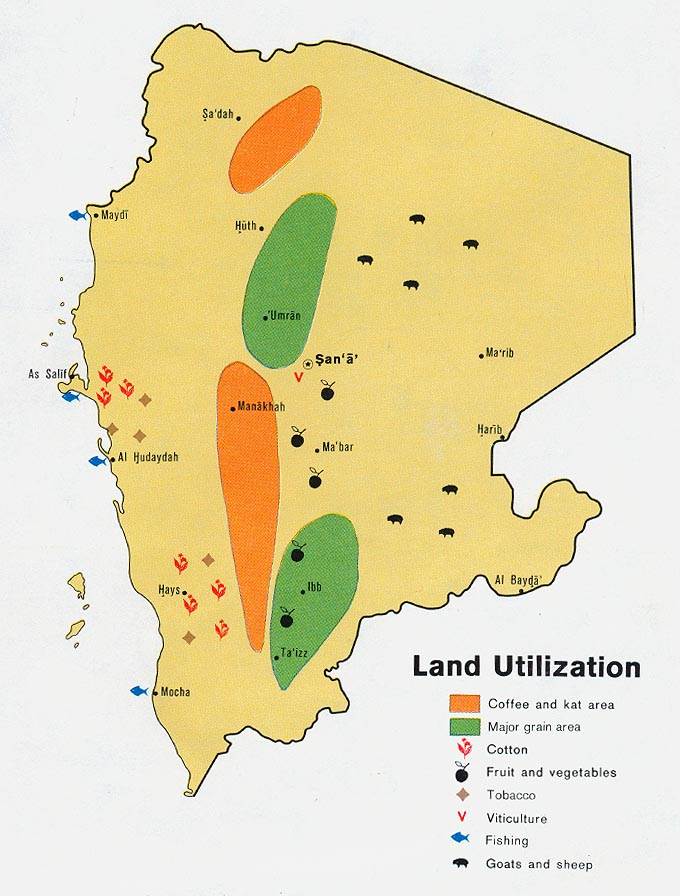
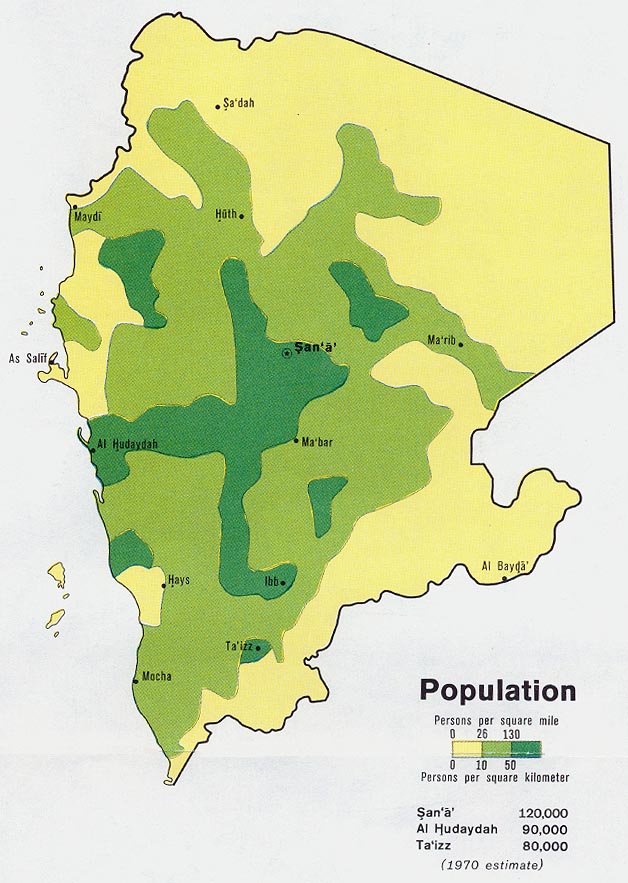
- Yemen - Northern - Population from Map No. 501036 1973 (127K)
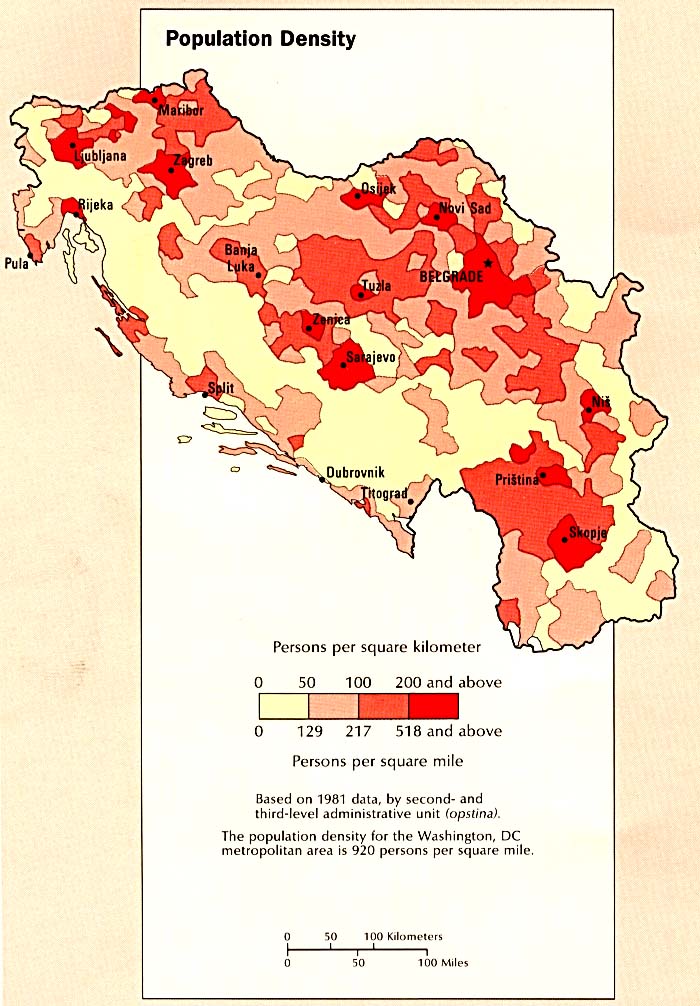
- Yugoslavia, Former - Population Density from the CIA Atlas of the Middle East 1993(124K)
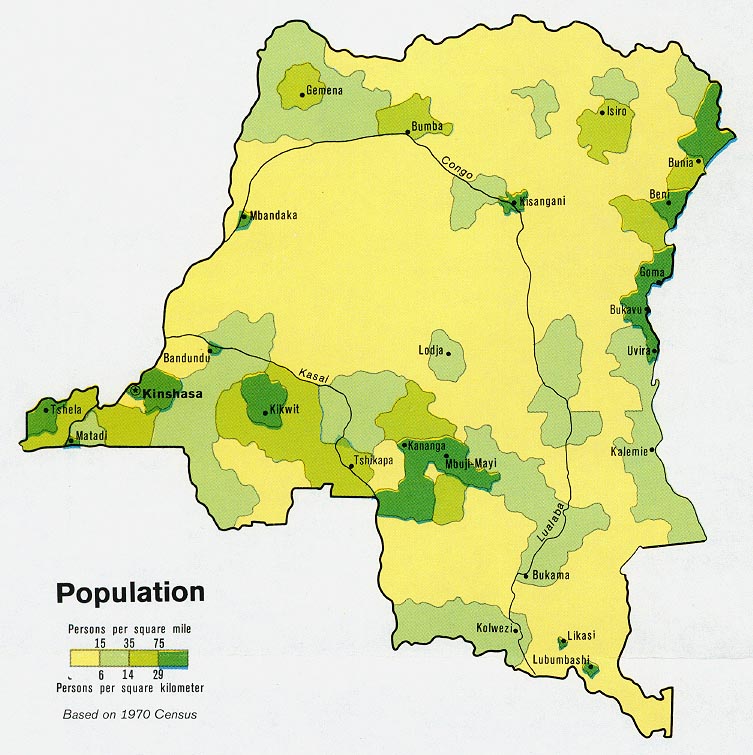
- Zaire - Population from Map No. 504165 1979 (130K)
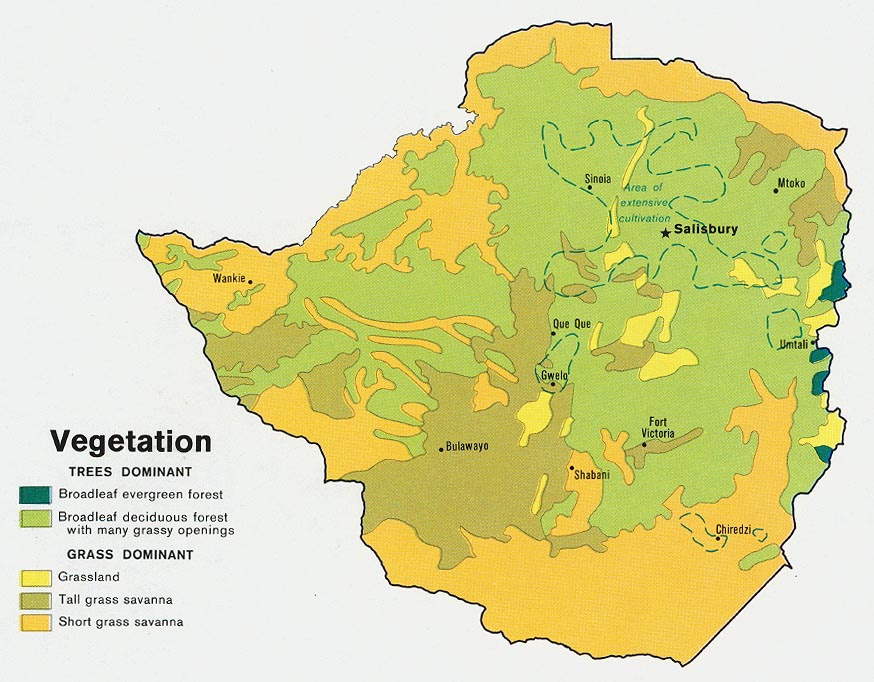
- [Zimbabwe] Rhodesia - Population from Map No. 543857 1979 (119K)
Thematic Maps on Other Web Sites
![[Caspian Region] Oil and Gas Infrastructure in the Caspian Sea Region](middle_east_and_asia/txu-pclmaps-oclc-785323952-caspian_sea_oil_and_gas.jpg)
![[Caspian Region] Oil and Gas Infrastructure in the Caspian Sea Region](middle_east_and_asia/caspian_sea_oil_gas-2001.jpg)
![[Russia] Soviet Union - Electric Power](commonwealth/ussr_elec_1974.jpg)
![[Russia] Soviet Union - Metallurgy](commonwealth/ussr_metal_1974.jpg)
![[Zimbabwe] Rhodesia - Mining](africa/south_rhodesia_mine_1979.jpg)
![[Burkina Faso] Upper Volta - Ethnic Groups](africa/upper_volta_ethnic_1968.jpg)
![[Russia] Soviet Union - Ethnic Groups](commonwealth/ussr_ethnic_1974.jpg)
![Vietnam [South] - Ethnic Groups](middle_east_and_asia/south_vietnam_ethnic_1972.jpg)
![[Burkina Faso] Upper Volta - Economic Activity](africa/upper_volta_econ_1968.jpg)
![[Czech and Slovak Republics] Czechoslovakia - Economic Activity](atlas_east_europe/czech-economy.jpg)
![[Czech and Slovak Republics] Czechoslovakia - Industries](europe/czechoslovakia_industry_1974.jpg)
![Korea [North] - Economic Activity](middle_east_and_asia/north_korea_econ_1972.jpg)
![Korea [South] - Economic Activity](middle_east_and_asia/south_korea_econ_1973.jpg)
![[Russia] Soviet Union - Machine Building and Metal Working](commonwealth/ussr_machine_1974.jpg)
![Vietnam [South] - Economic Activity](middle_east_and_asia/south_vietnam_econ_1972.jpg)
![[Zimbabwe] Rhodesia - Economic Activity](africa/south_rhodesia_econ_1979.jpg)
![[Burkina Faso] Upper Volta - Vegetation](africa/upper_volta_veg_1968.jpg)
![[Czech and Slovak Republics] Czechoslovakia - Land Use](atlas_east_europe/czech-landuse.jpg)
![Korea [North] - Land Utilization](middle_east_and_asia/north_korea_land_1972.jpg)
![Korea [South] - Vegetation and Land Utilization](middle_east_and_asia/south_korea_veg_1973.jpg)
![Vietnam [South] - Land Utilization and Vegetation](middle_east_and_asia/south_vietnam_land_1972.jpg)
![[Zimbabwe] Rhodesia - Land Apportionment](africa/south_rhodesia_land_1979.jpg)
![[Burkina Faso] Upper Volta - Population](africa/upper_volta_pop_1968.jpg)
![[Czech and Slovak Republics] Czechoslovakia - Population Density](atlas_east_europe/czech-pop.jpg)
![[Czech and Slovak Republics] Czechoslovakia - Population](europe/czechoslovakia_pop_1974.jpg)
![Korea [North] - Population](middle_east_and_asia/north_korea_pop_1972.jpg)
![Korea [South] - Population](middle_east_and_asia/south_korea_pop_1973.jpg)
![[Russia] Soviet Union - Population](commonwealth/ussr_pop_1974.jpg)
![Vietnam [South] - Population](middle_east_and_asia/south_vietnam_pop_1972.jpg)
![[Zimbabwe] Rhodesia - Population](africa/south_rhodesia_pop_1979.jpg)